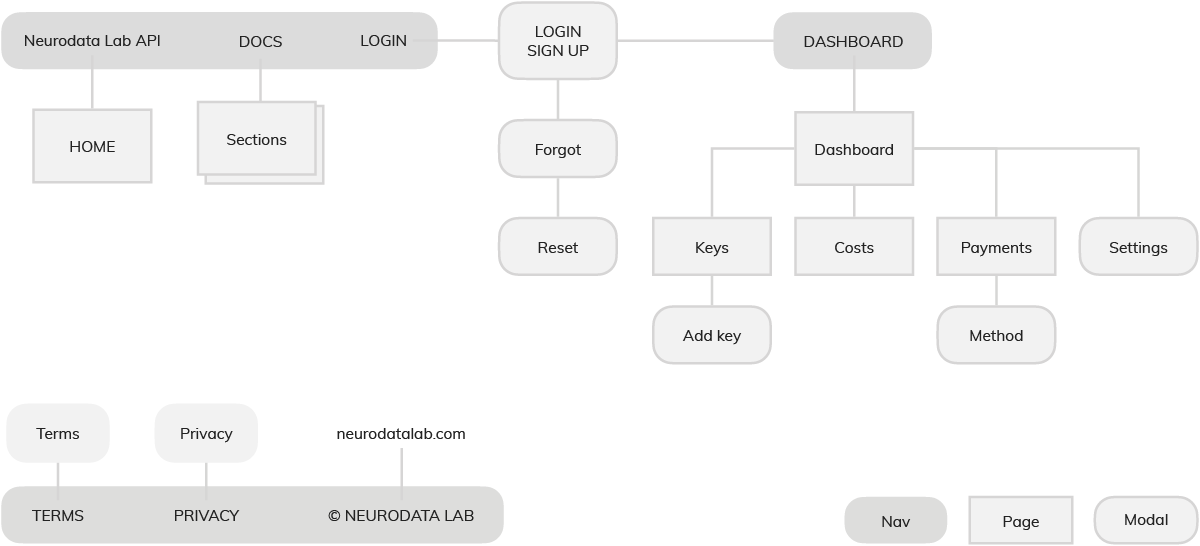
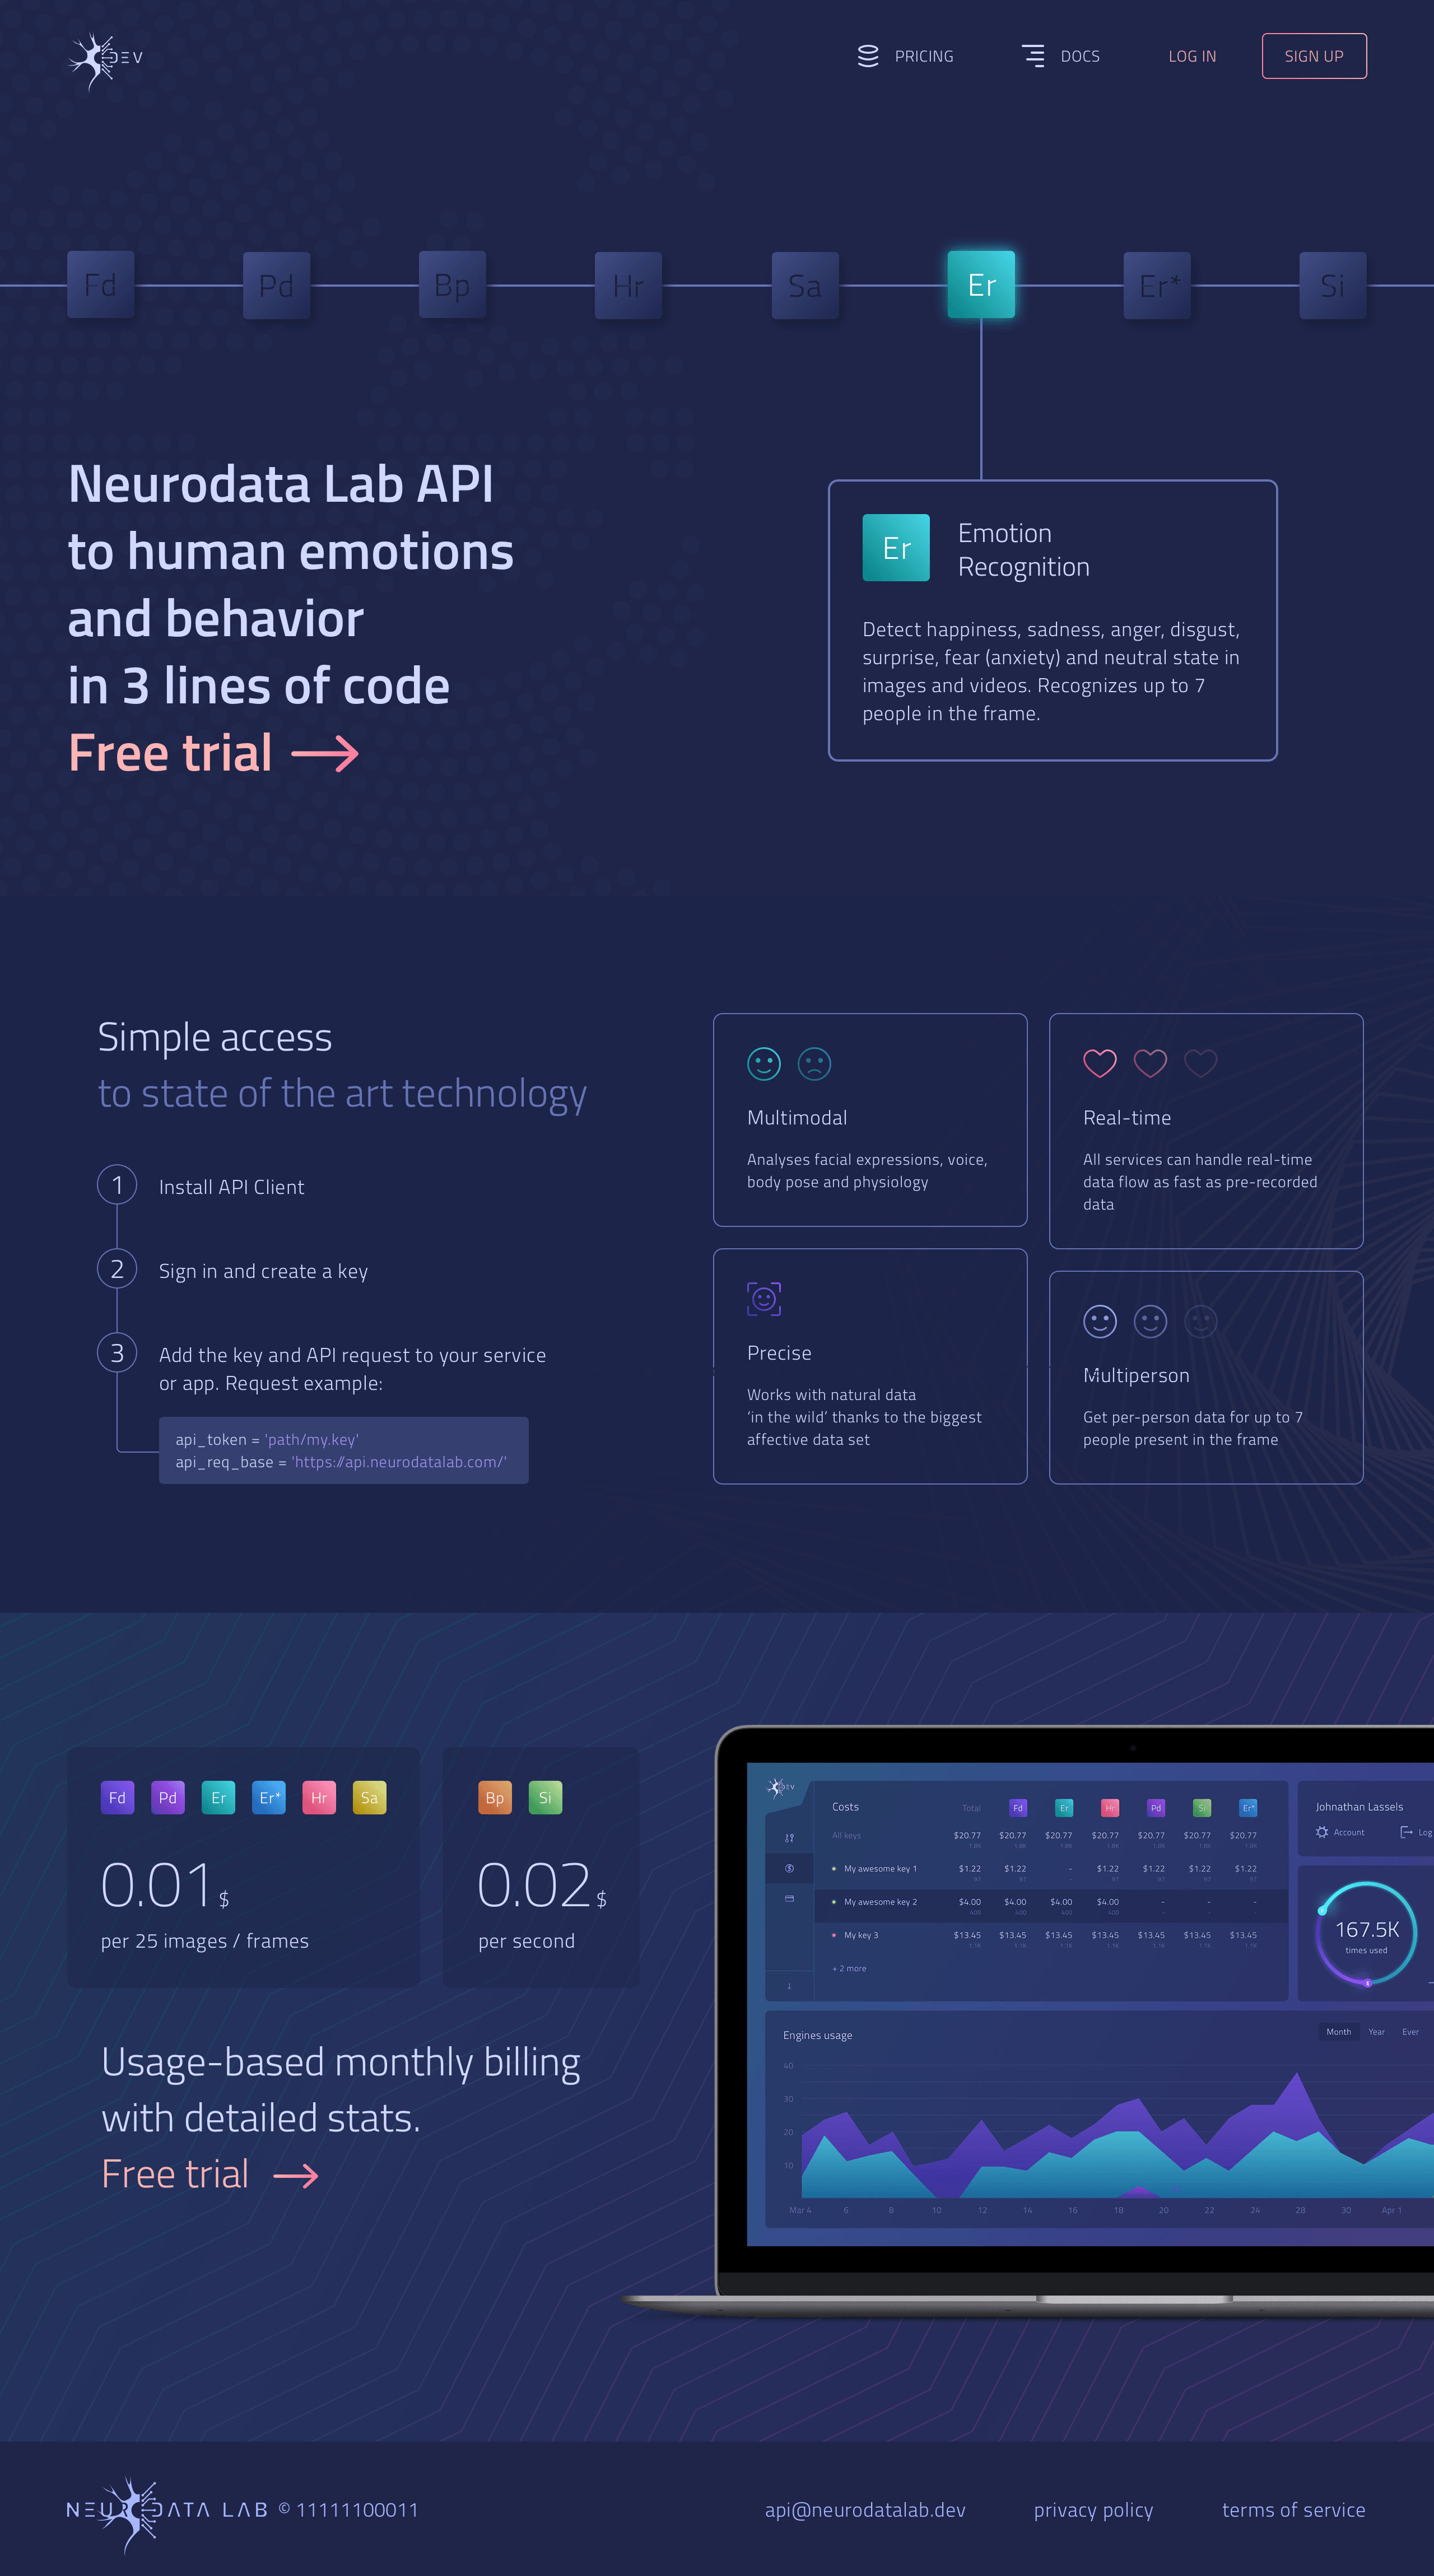
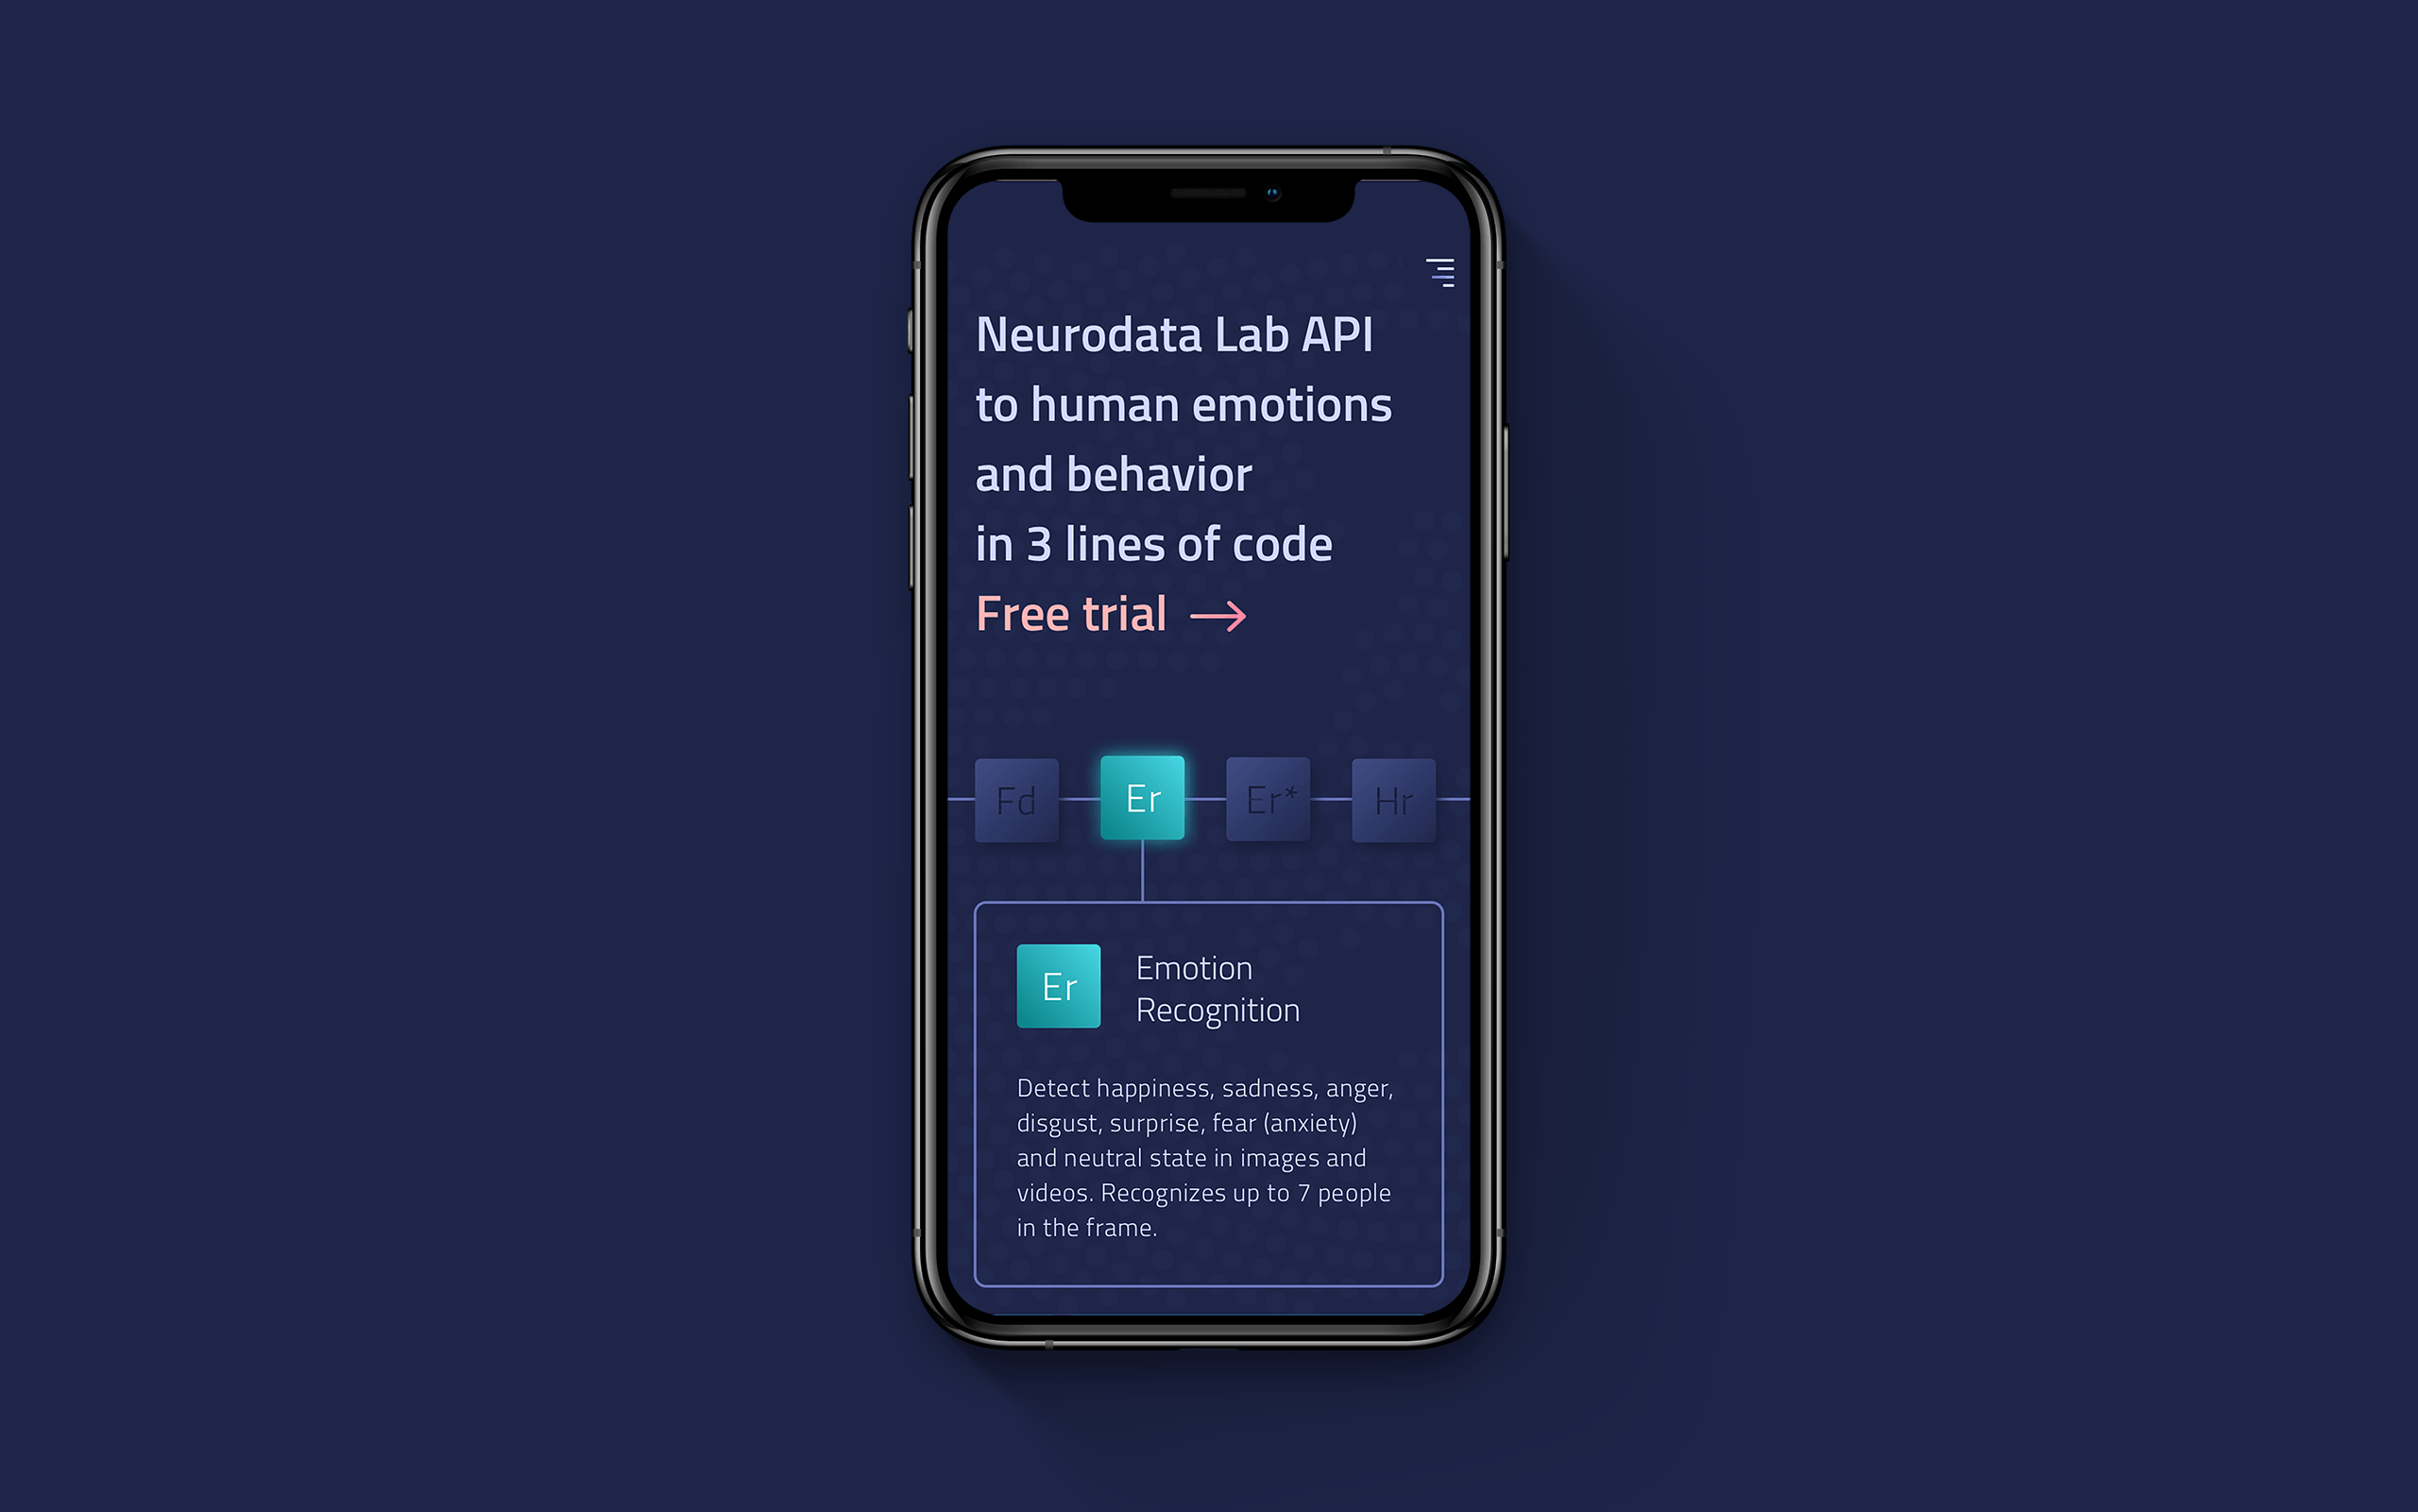
Neurodata Lab API
Interaction design
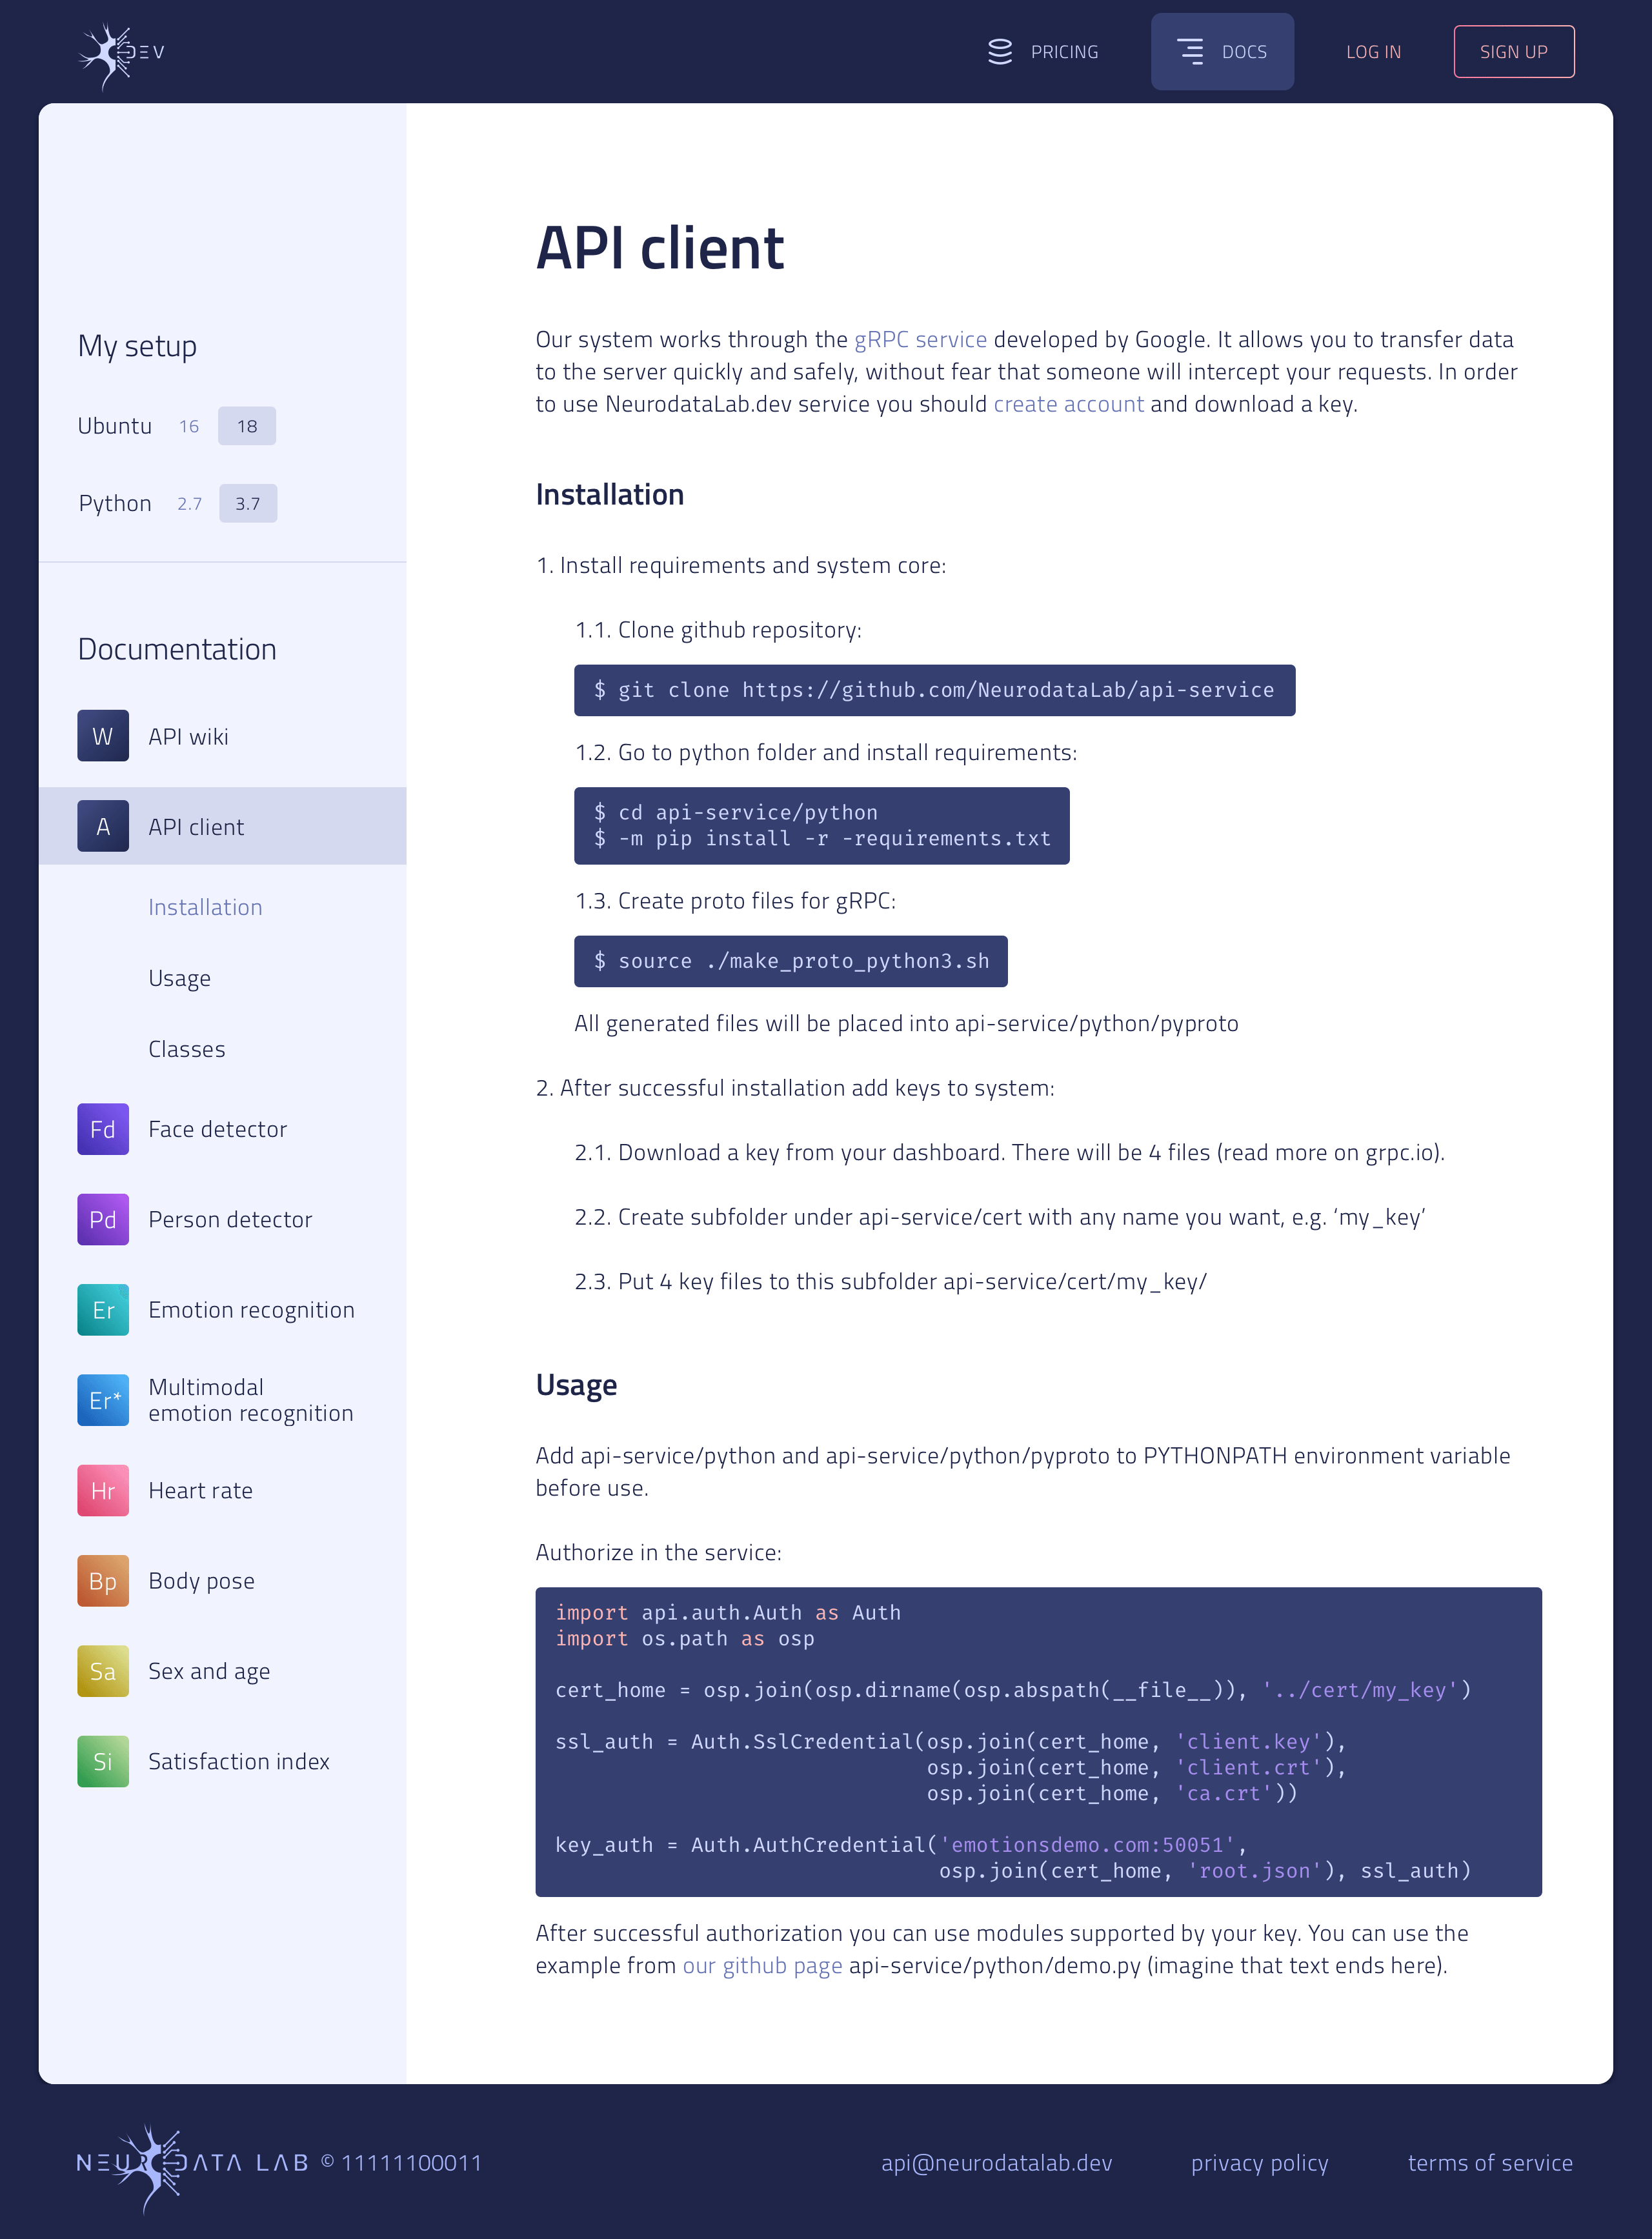
Neurodata Lab API service provides developer access to the Neurodata Lab affective computing and computer vision technologies.
Intro and structure
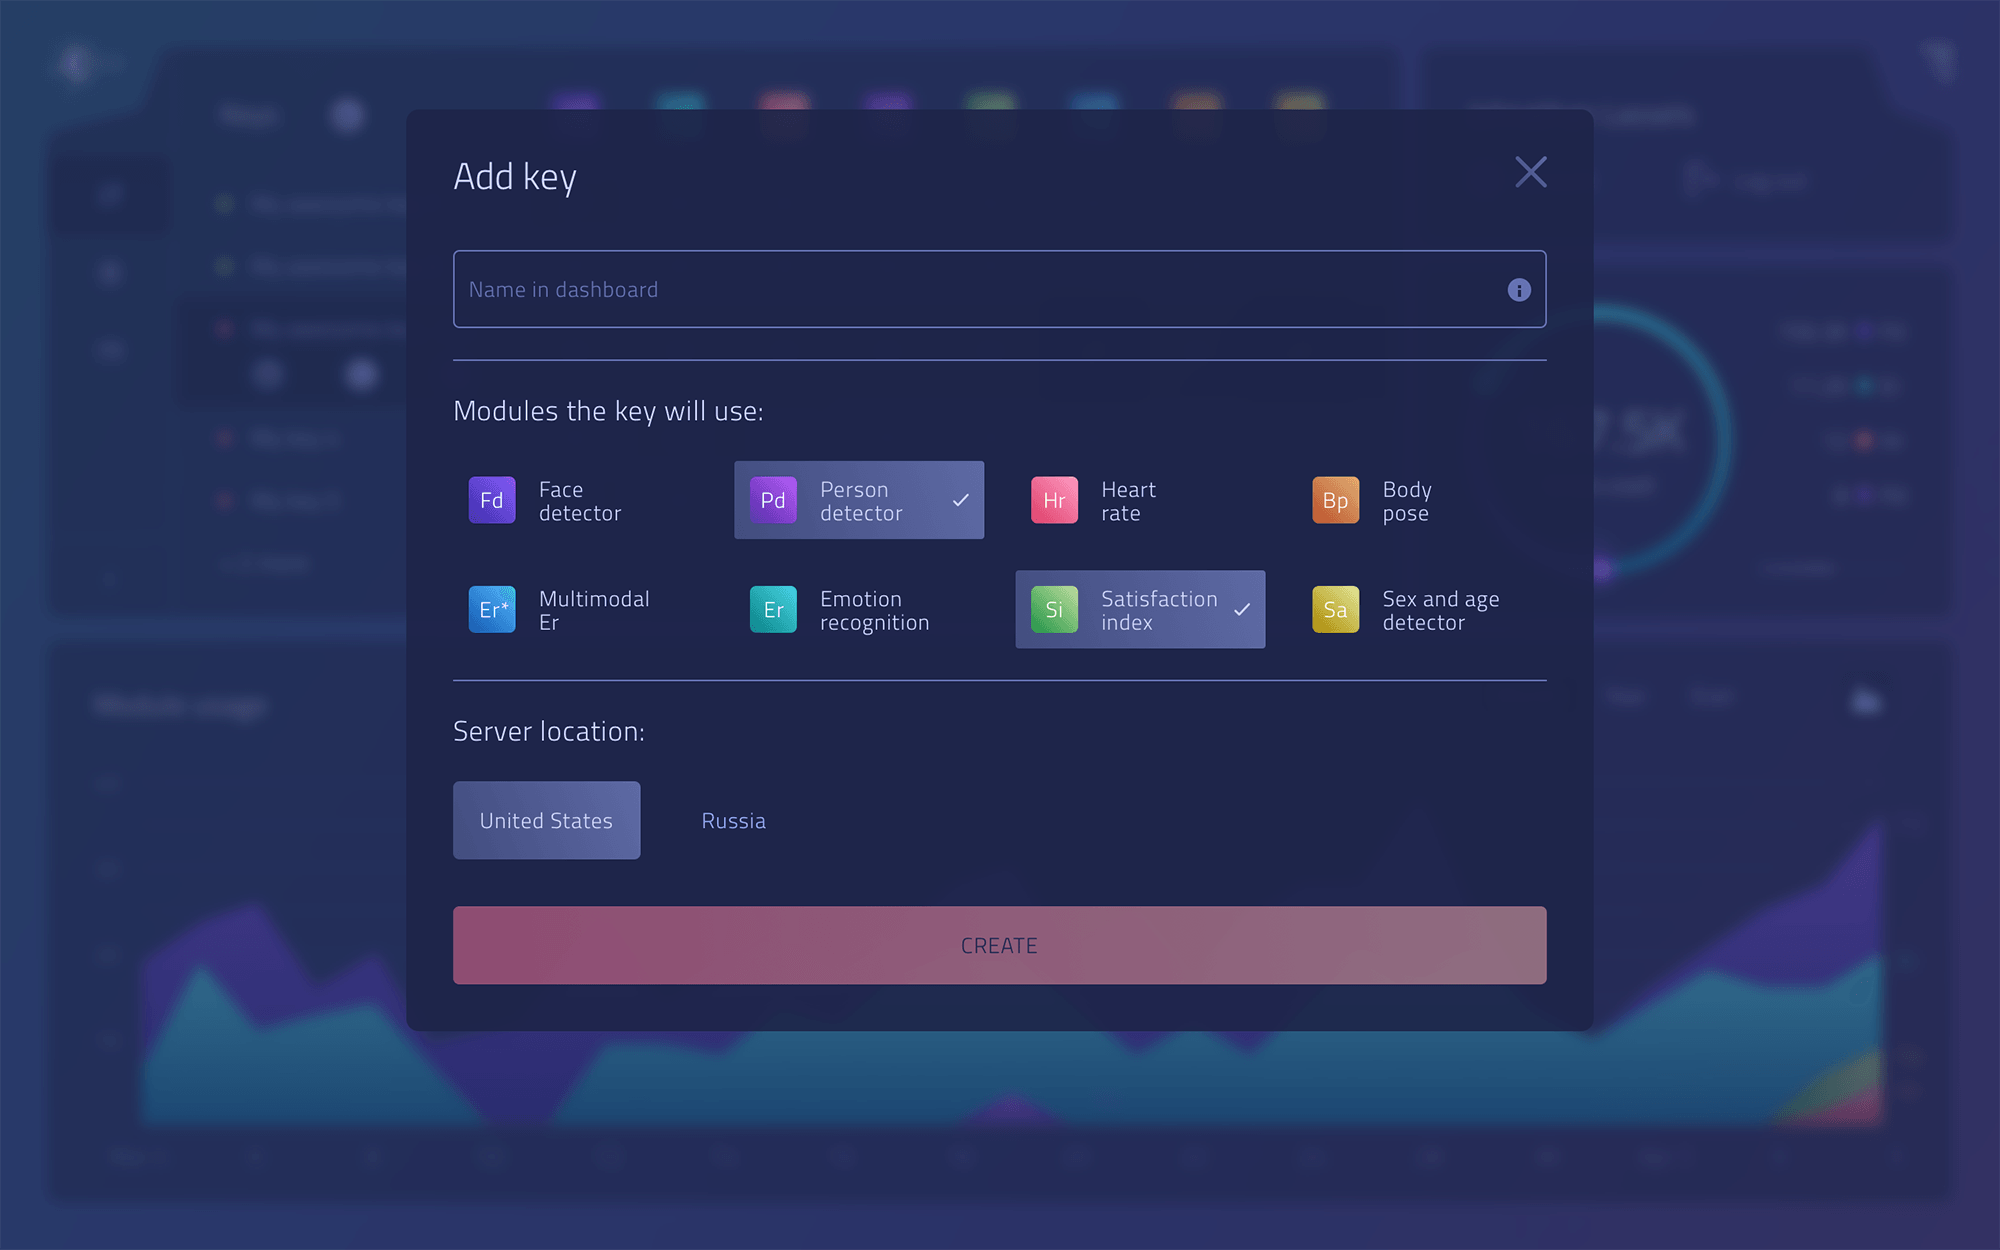
The service allows a developer to integrate Neurodata Lab solutions into his product or service - with literally just 3 lines of code. For that the developer is provided with documentation and tools to manage and pay for API keys. All solutions (modules) assume remote processing of audiovisual content. Already available modules are:
- Face detector (Fd)
- Person detector (Pd)
- Emotion recognition (Er)
- Multimodal emotion recognition (Er*)
- Heart rate detector (Hr)
- Body pose estimation (Bp)
- Customer satisfaction index (Si)
- Sex & age detector (Sa)
Creating the below design I made the first attempt to come up with a draft guideline - made a palette for modules and an icon pack, picked a webfont that is similar to the Neurodata Lab logo.
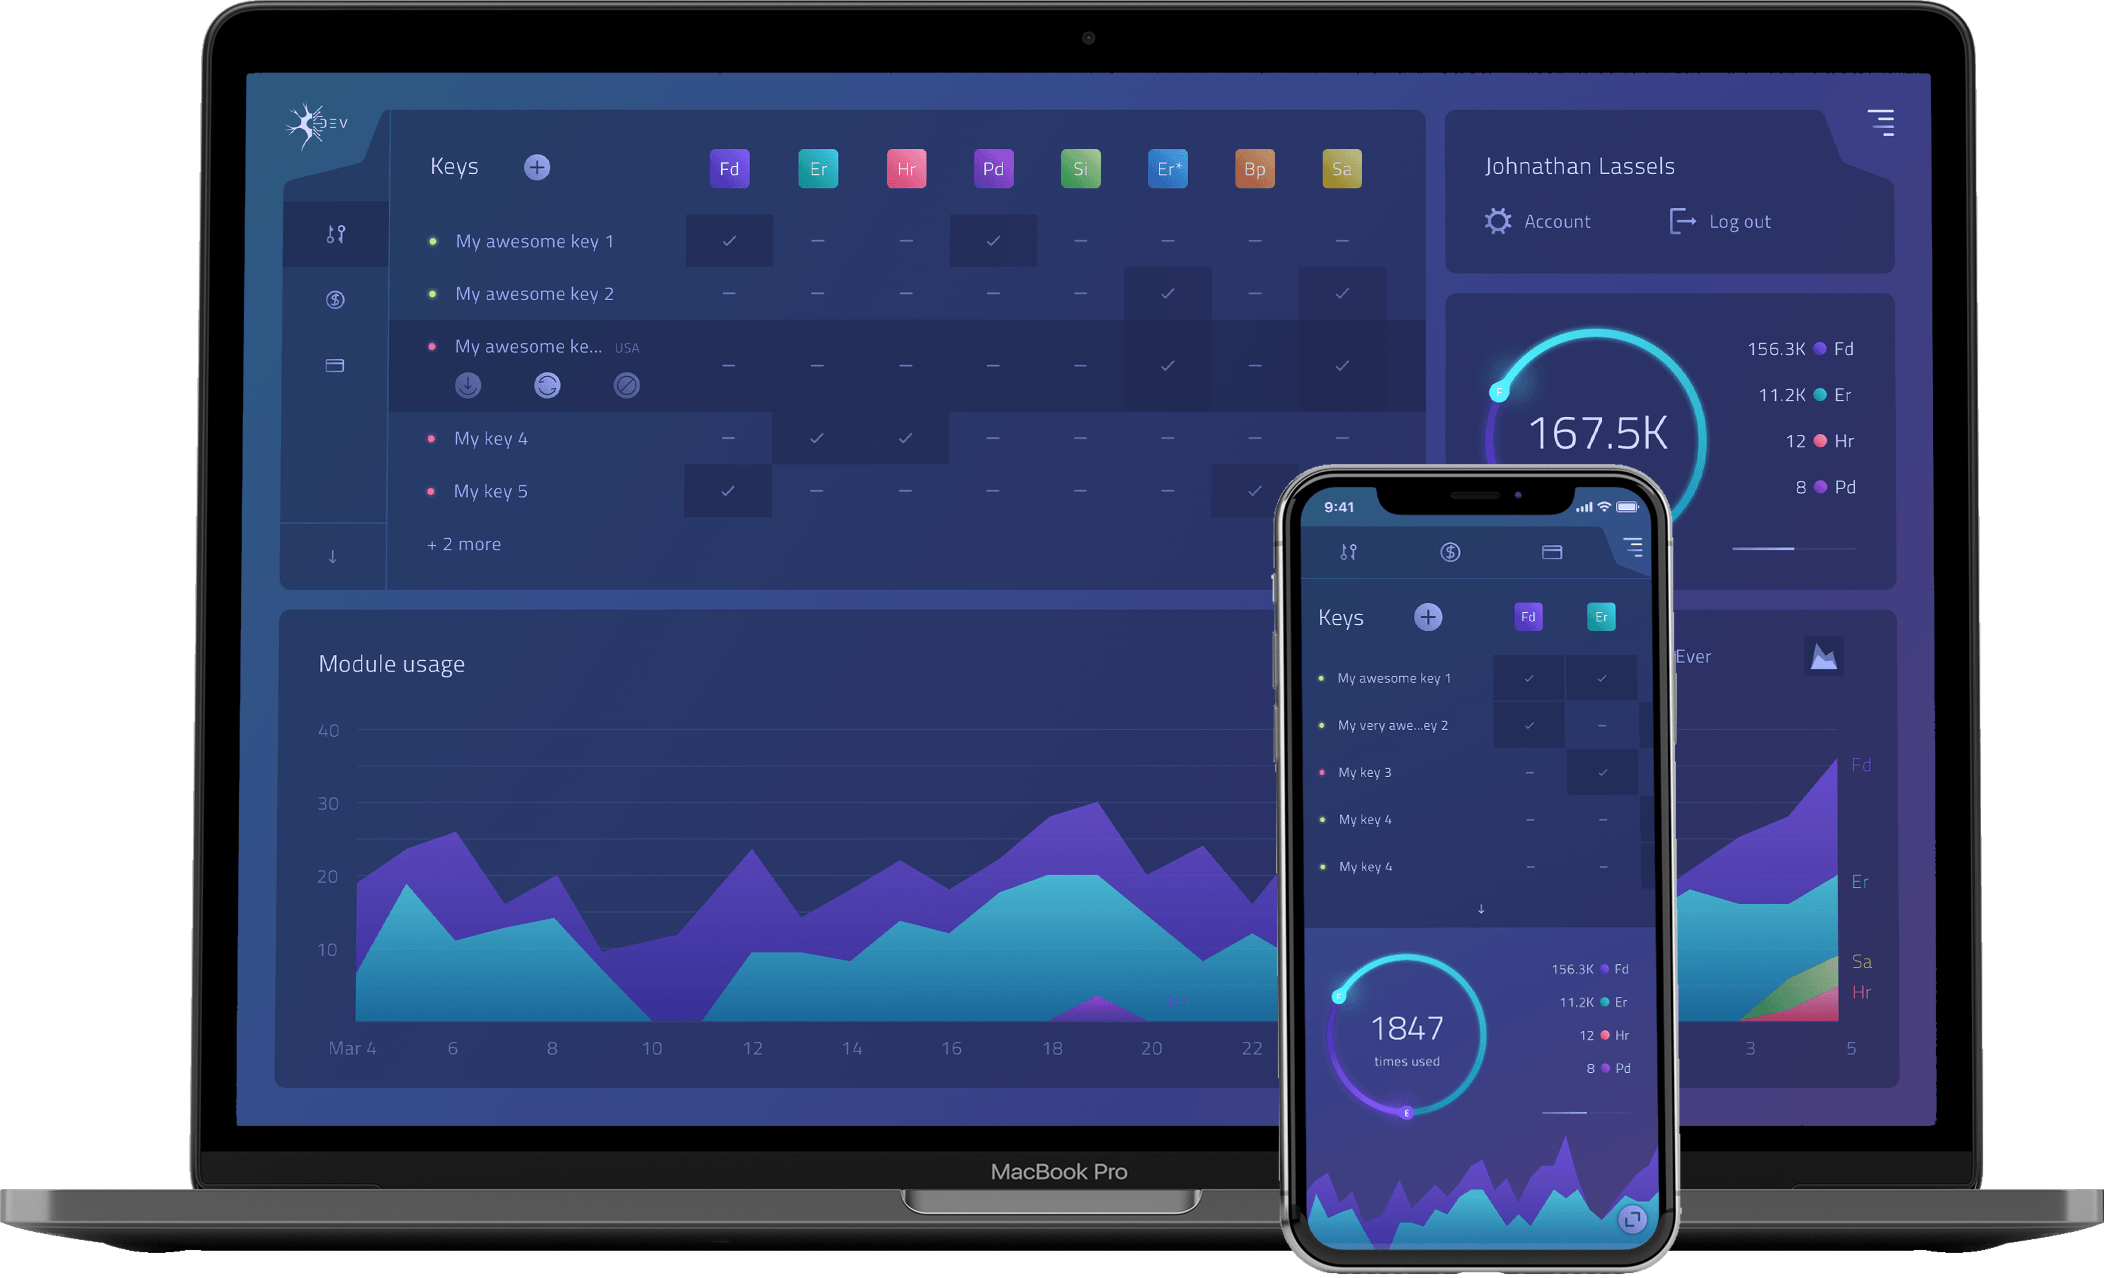
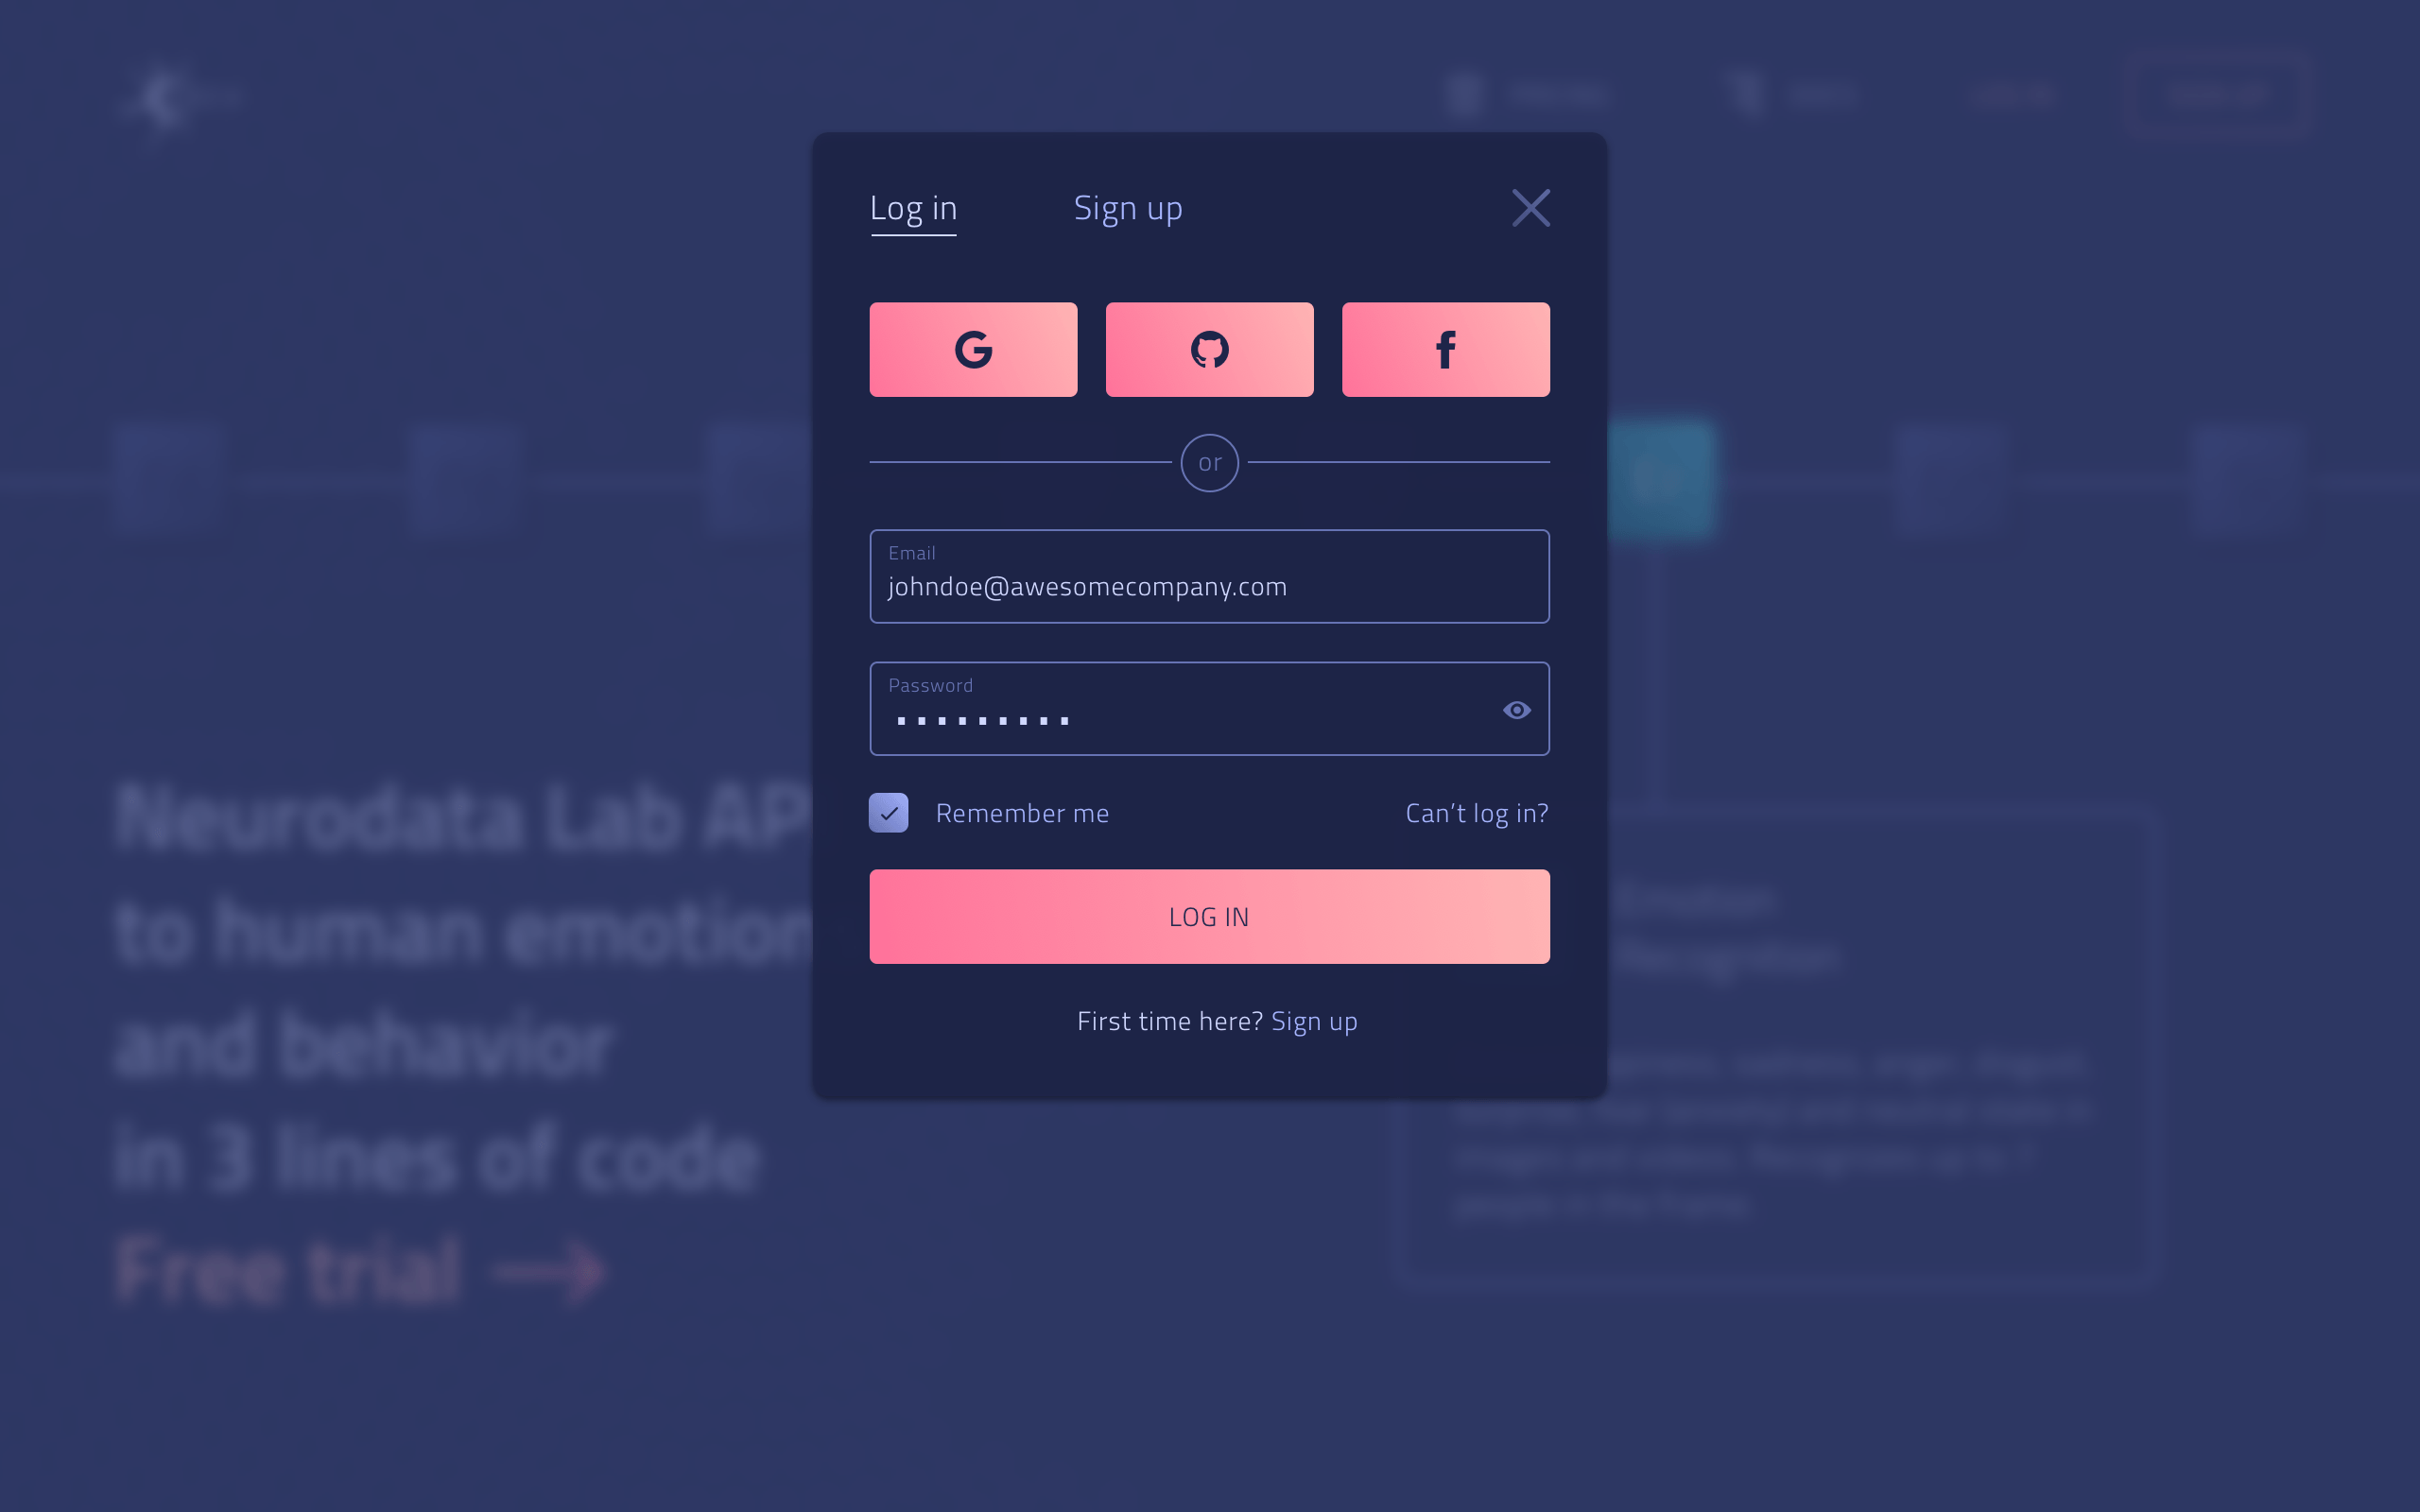
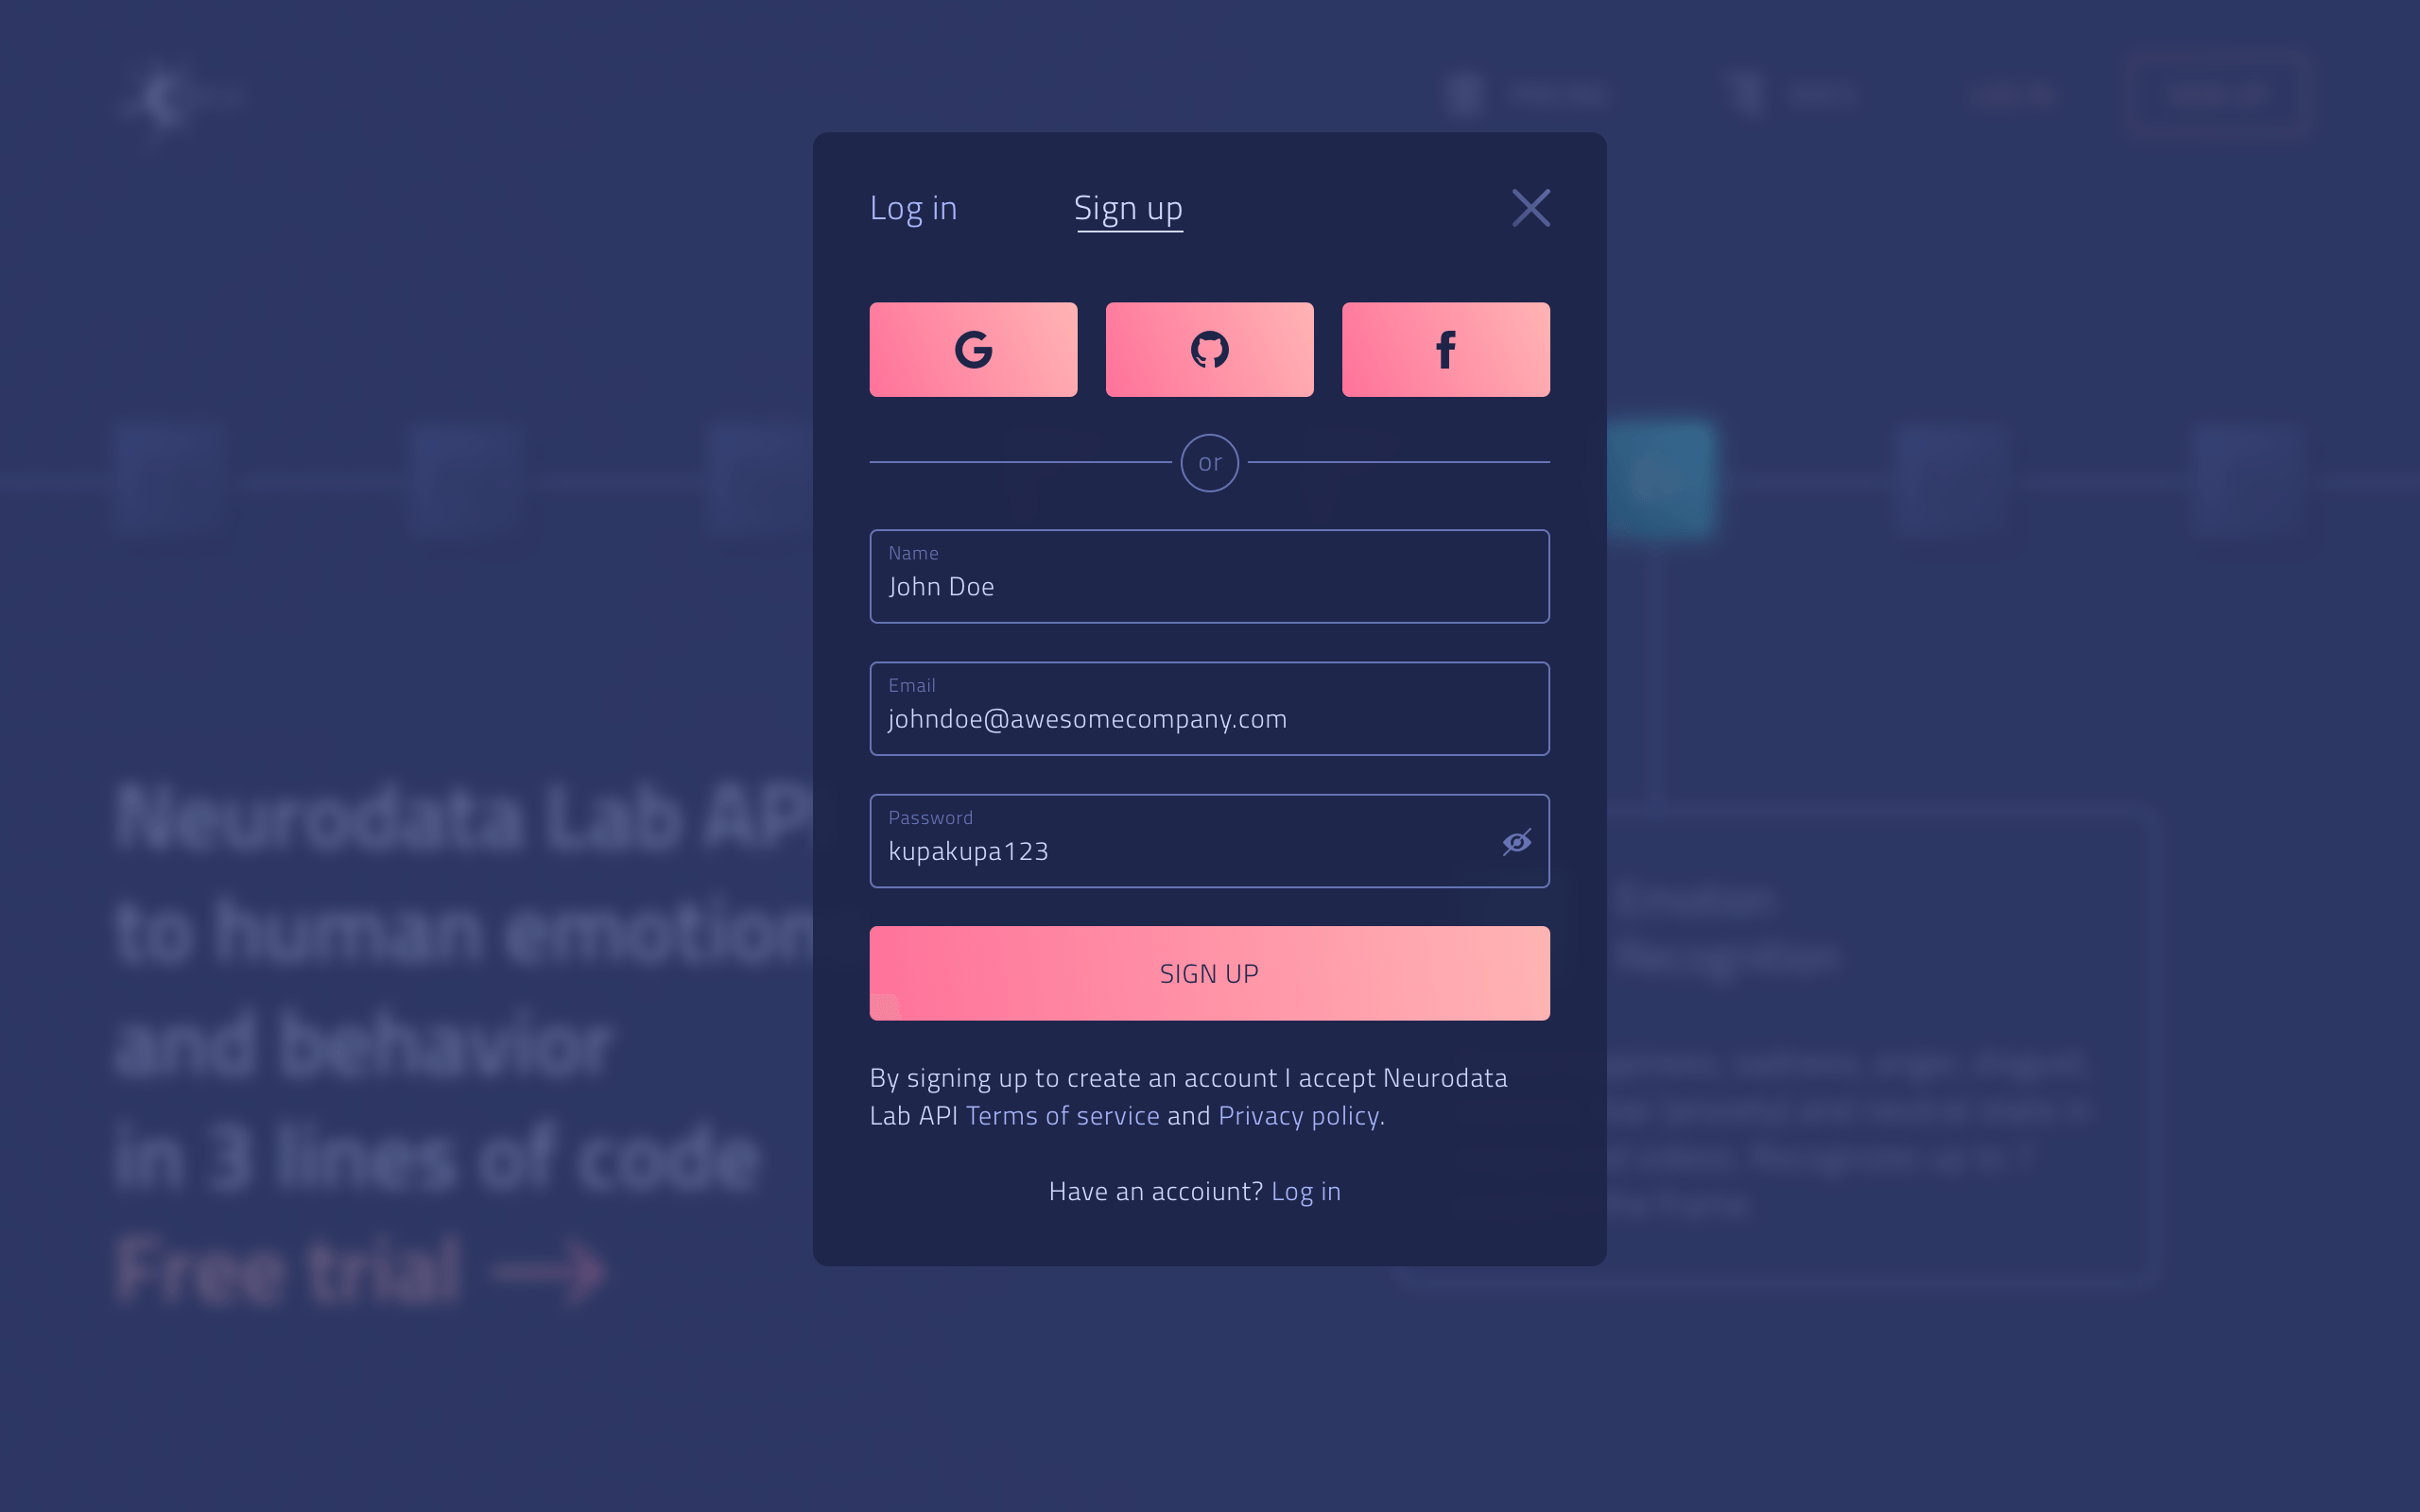
The biggest part of this projects was the authorized zone - the developer's dashboard - so I will start right from it.
Dashboard
'Why the dashboard is blue?' some were asking. Then in a few days they were coming back with 'you know, the blue theme is kinda growing on me, leave it'. The theme was created rather to show off in promotional materials but after all made it to the production first - before a simpler white default theme. Well, now the beta will show if it was a bad move.
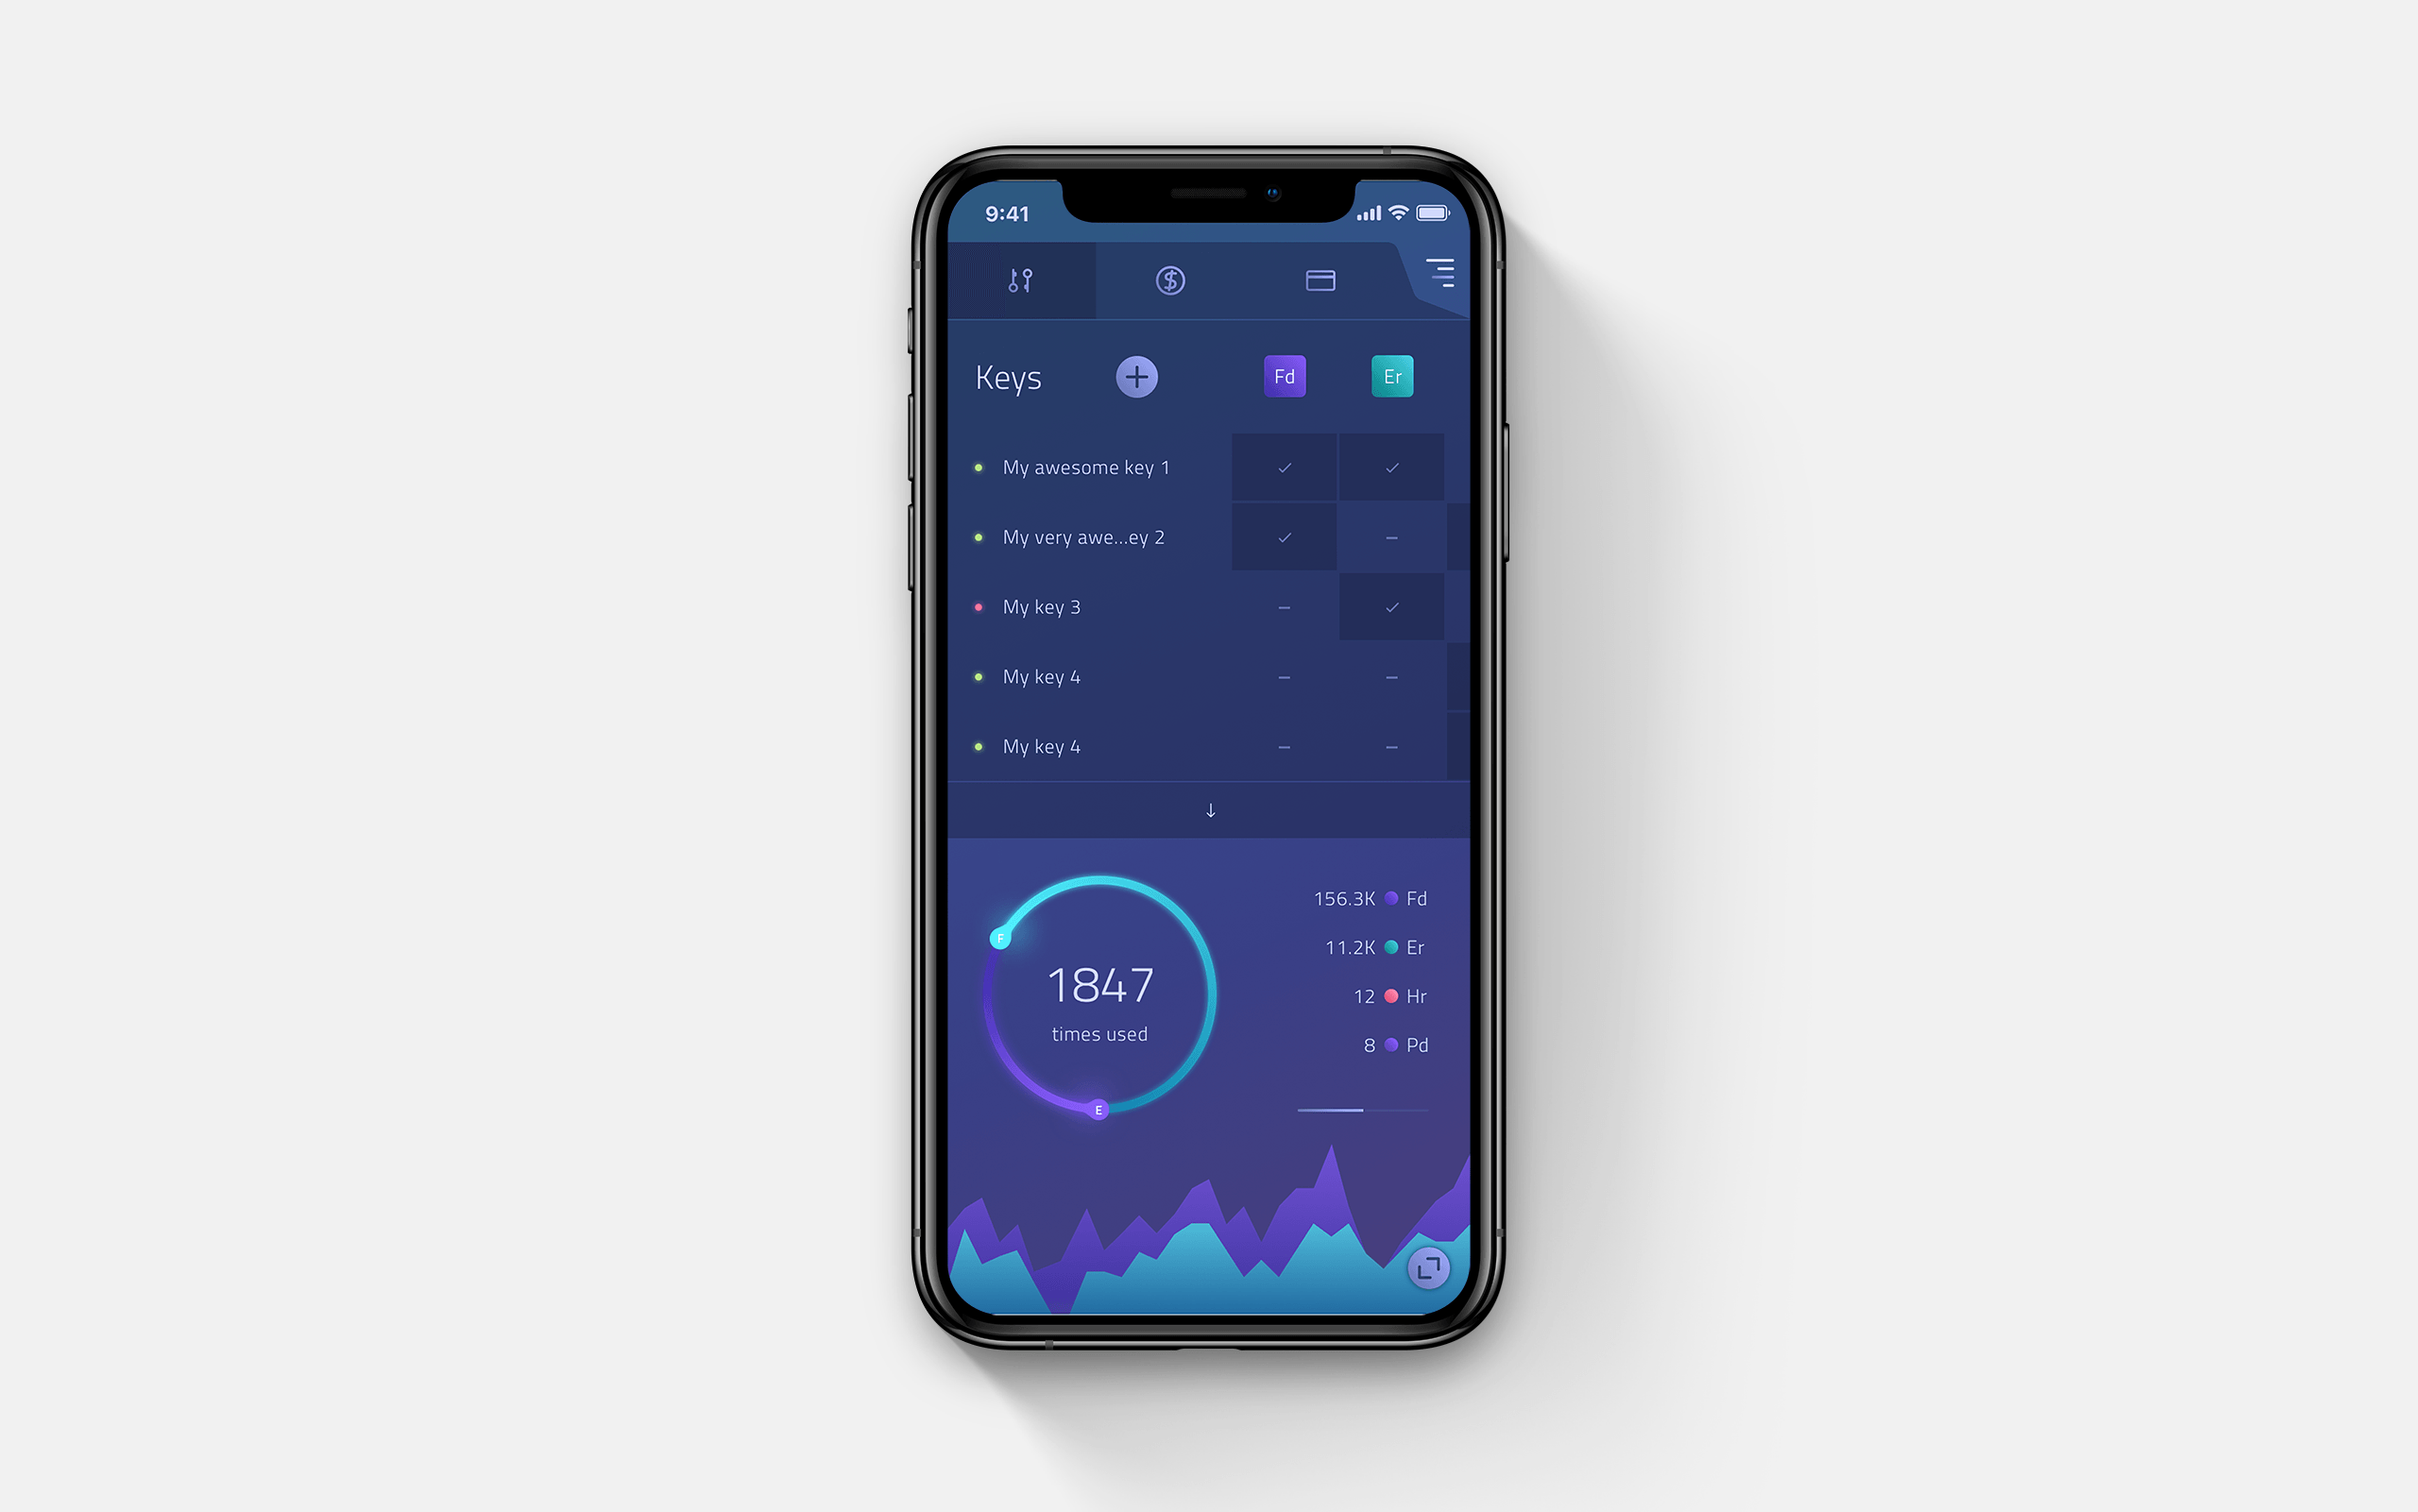
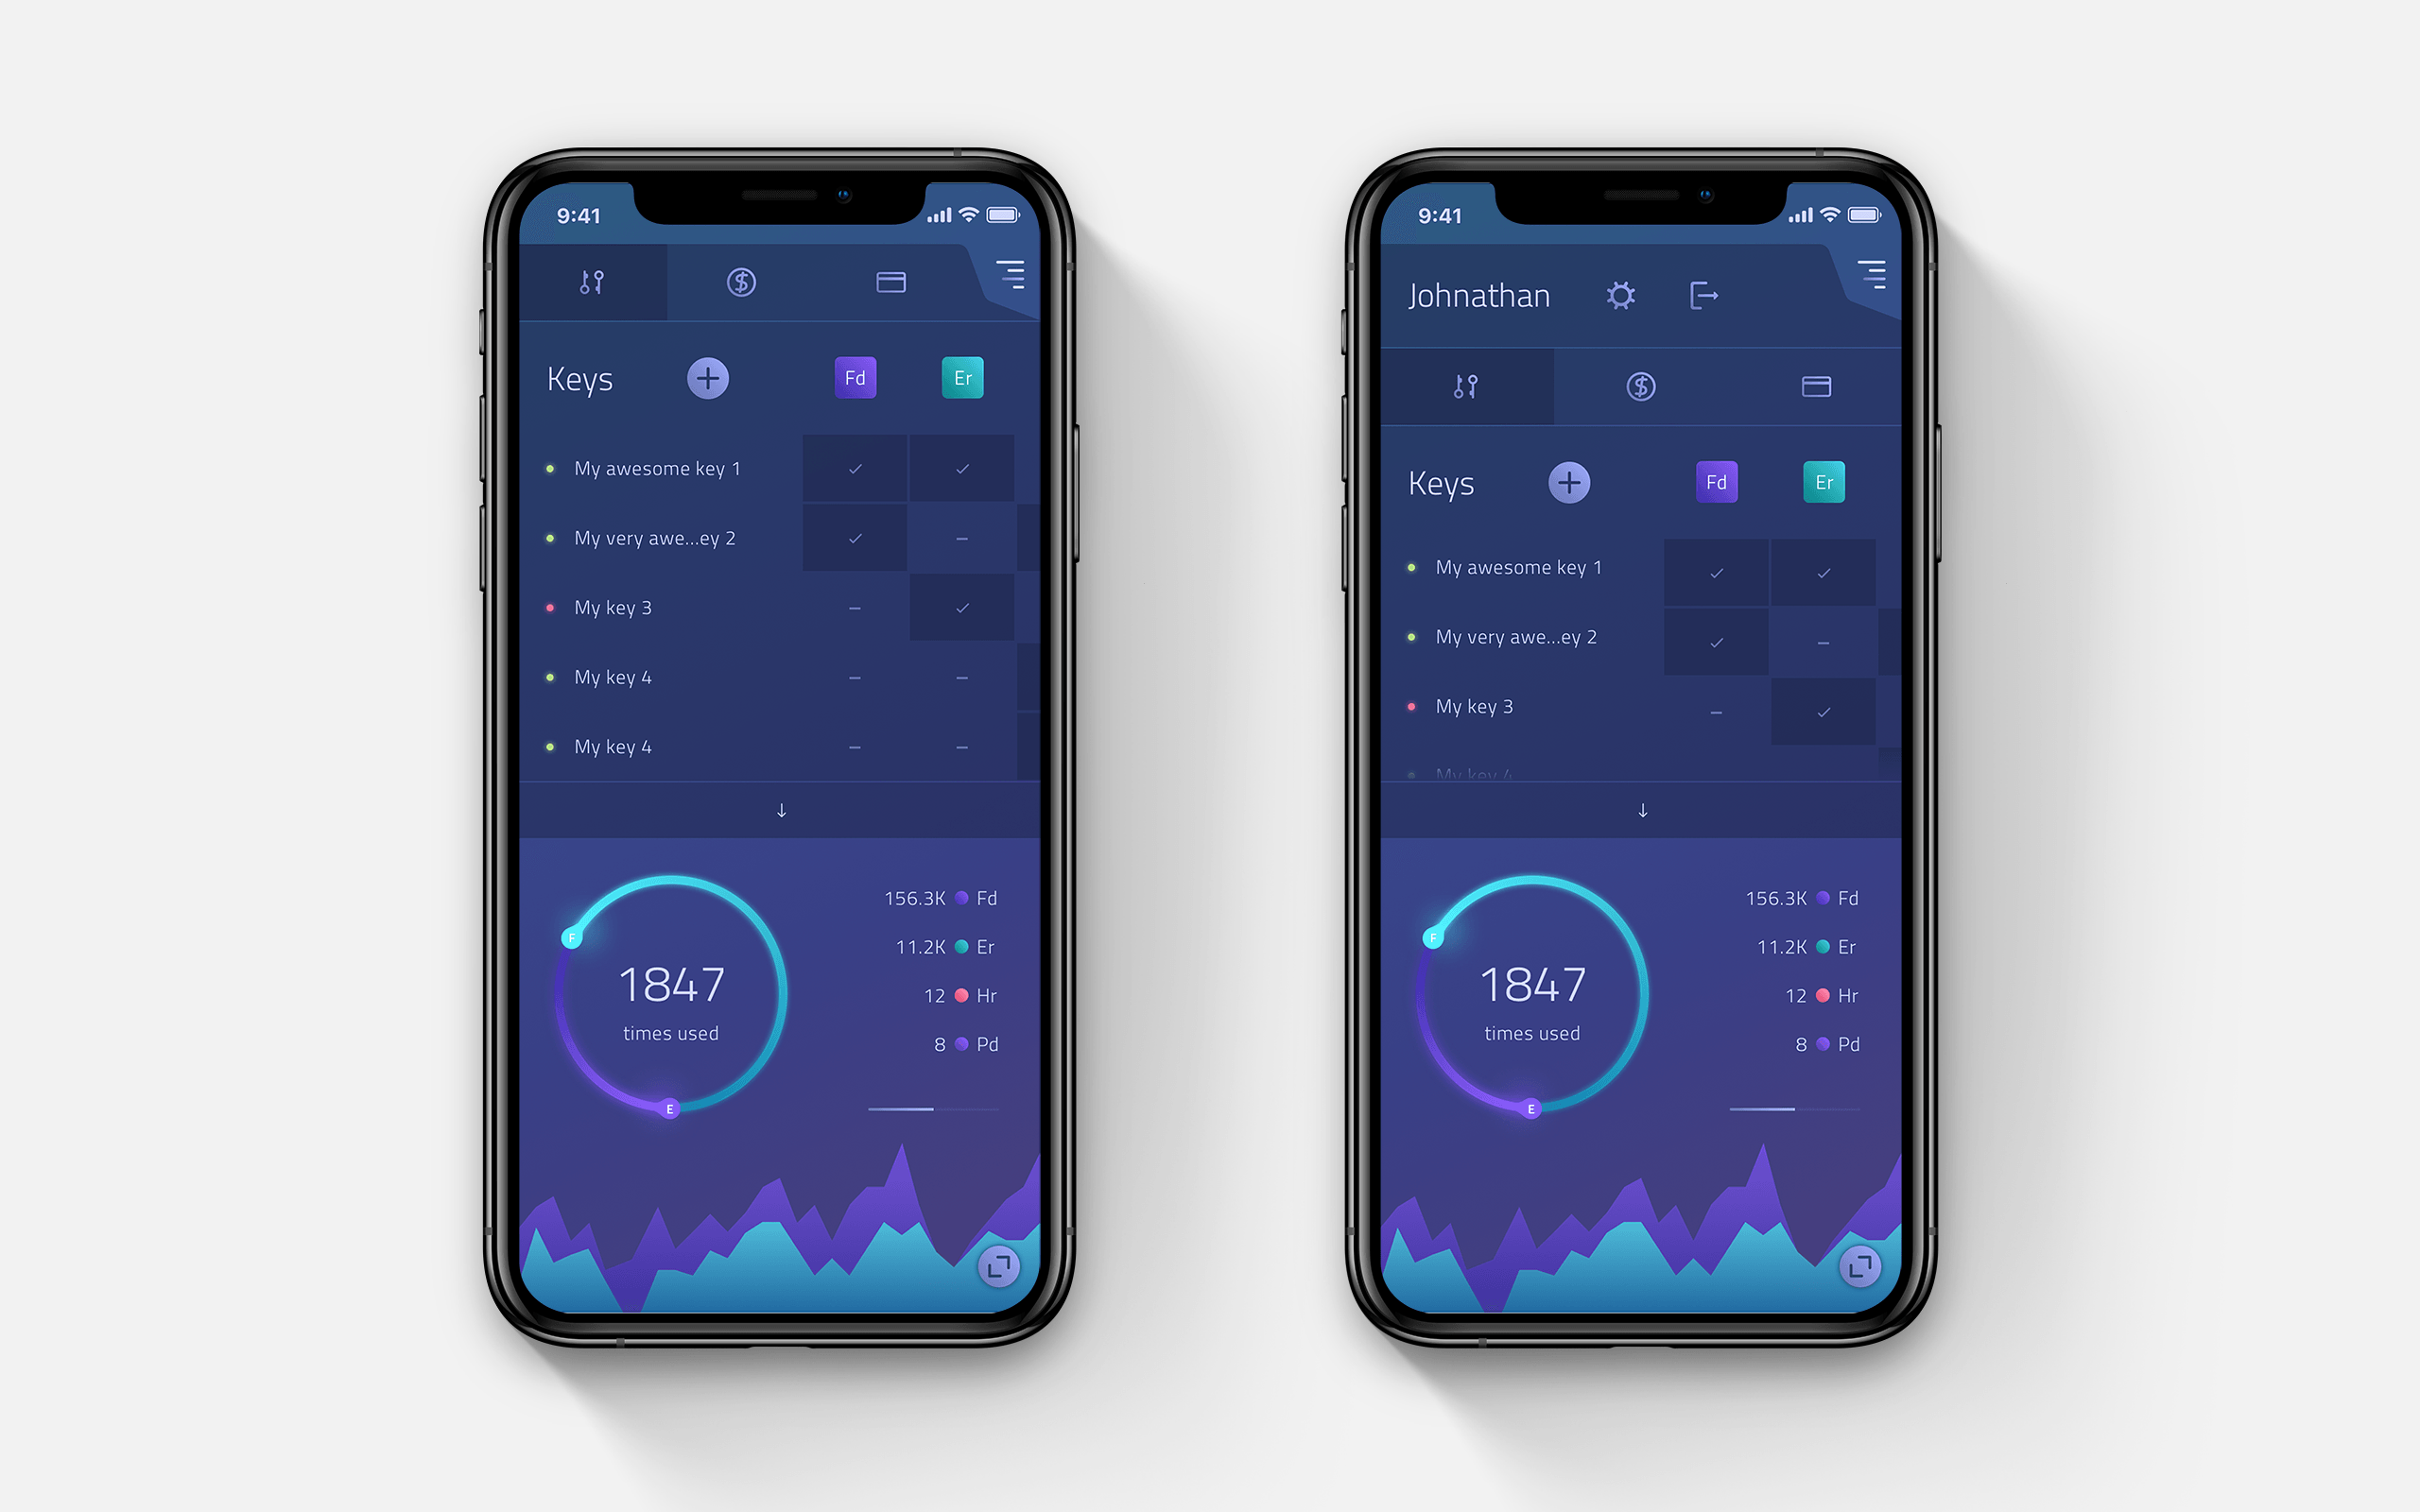
Dashboard has a cover layout on desktop, i.e. its edges are stick to the viewport. Table tab is scrollable vertically and horizontally, expandable vertically.
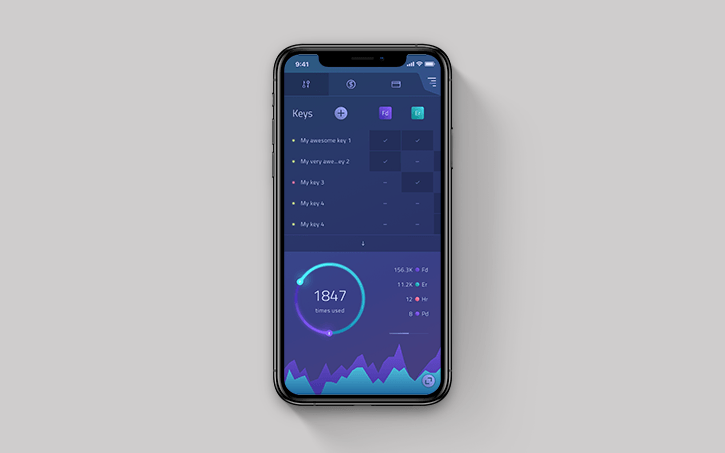
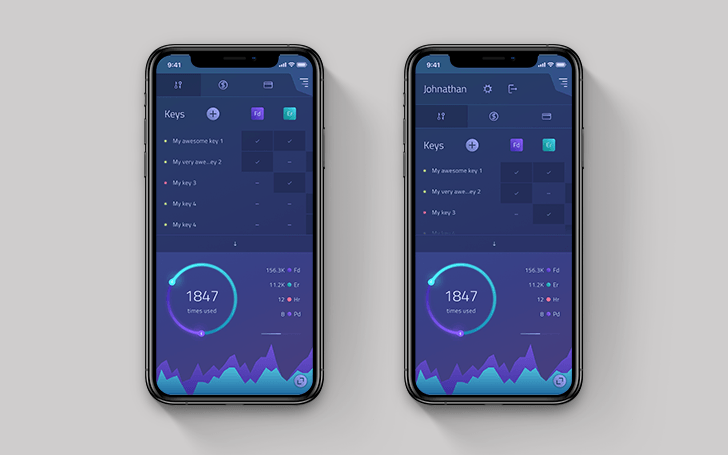
Keys
One key can give access to one or more modules. The default 'Keys' tab lists keys (active first), shows what modules they give access to and allows to create, download, update or revoke a key.
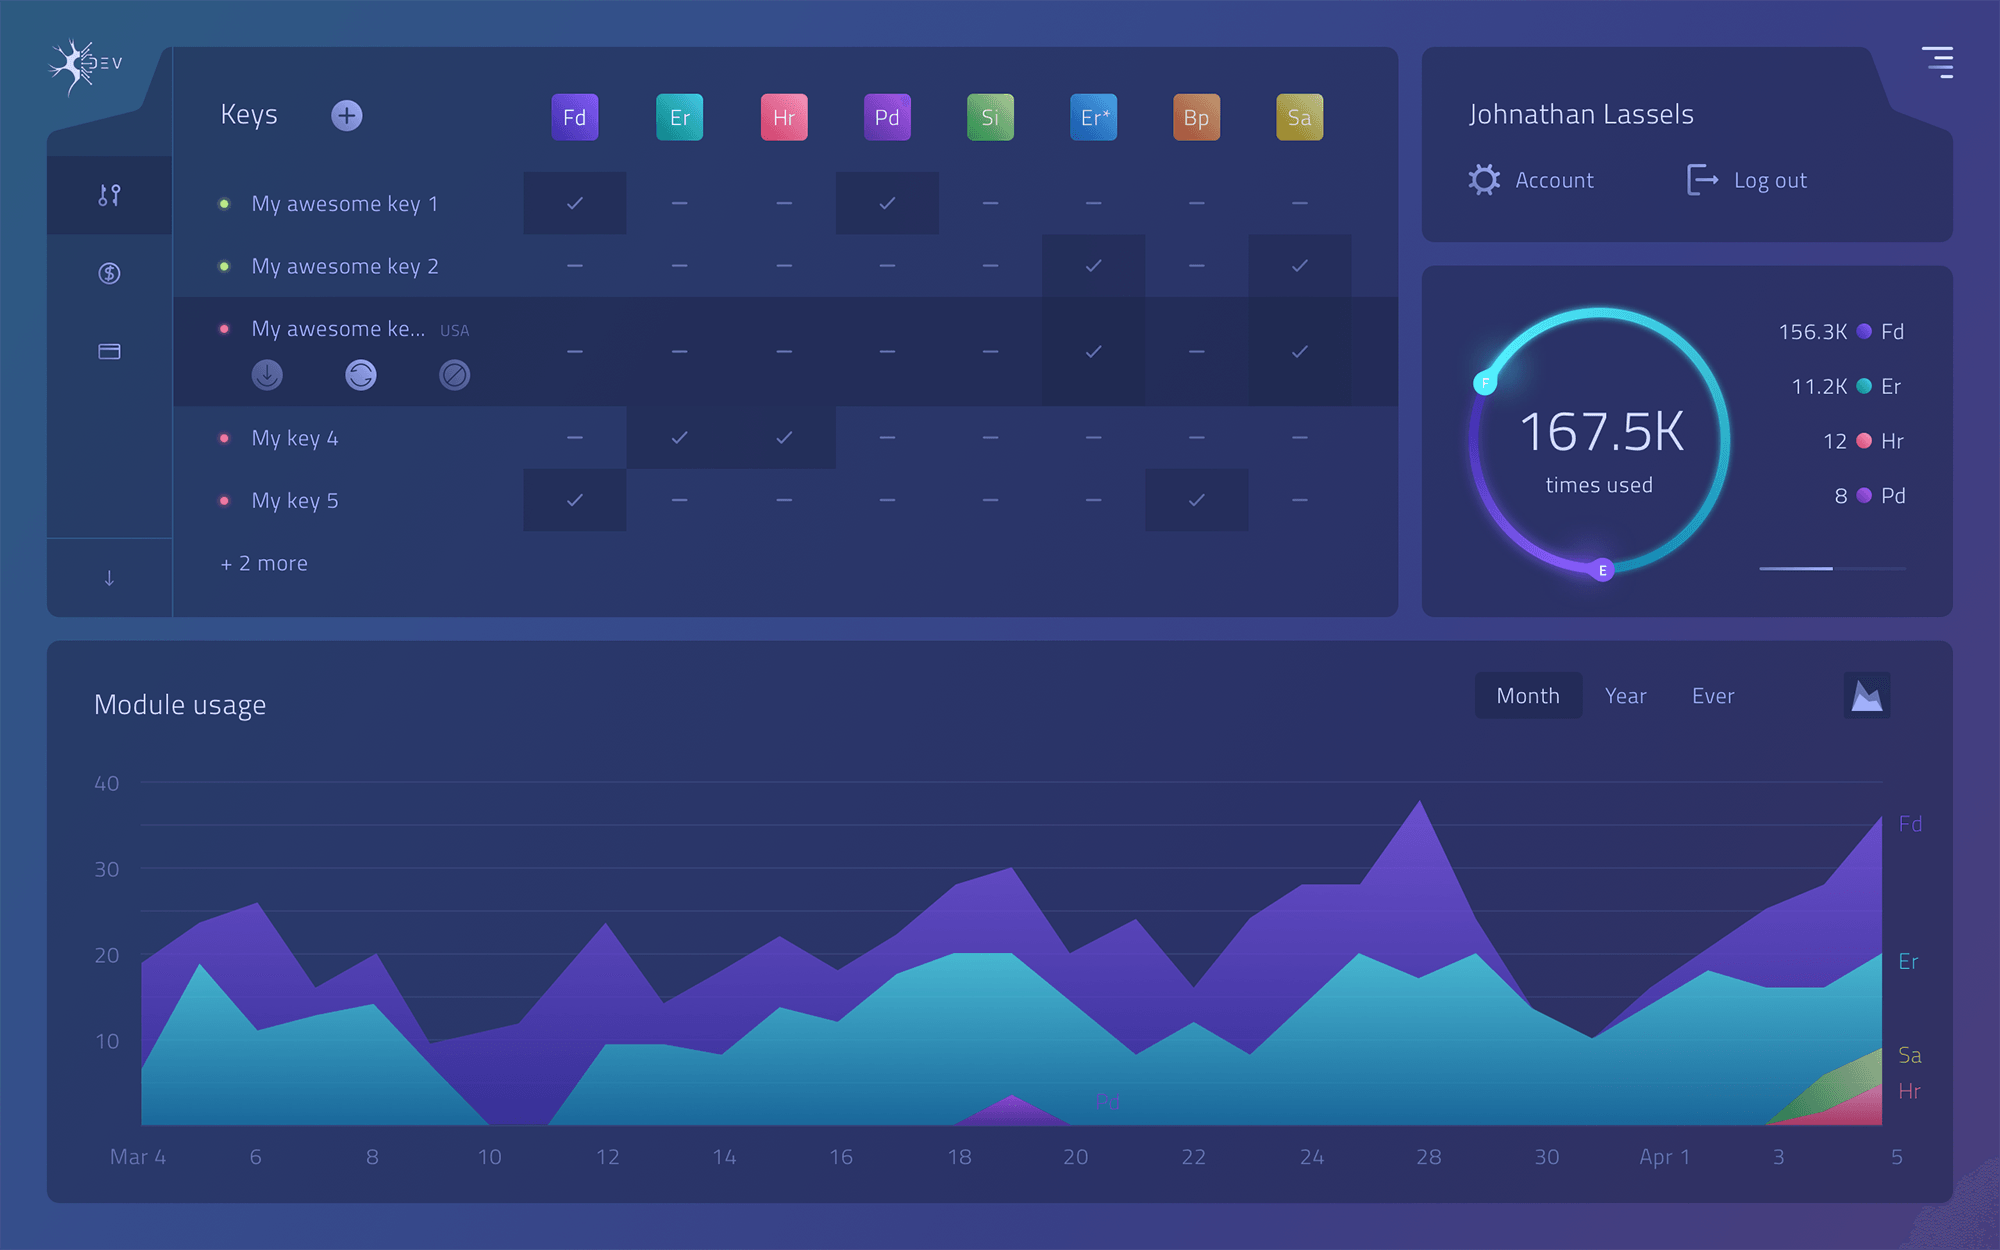
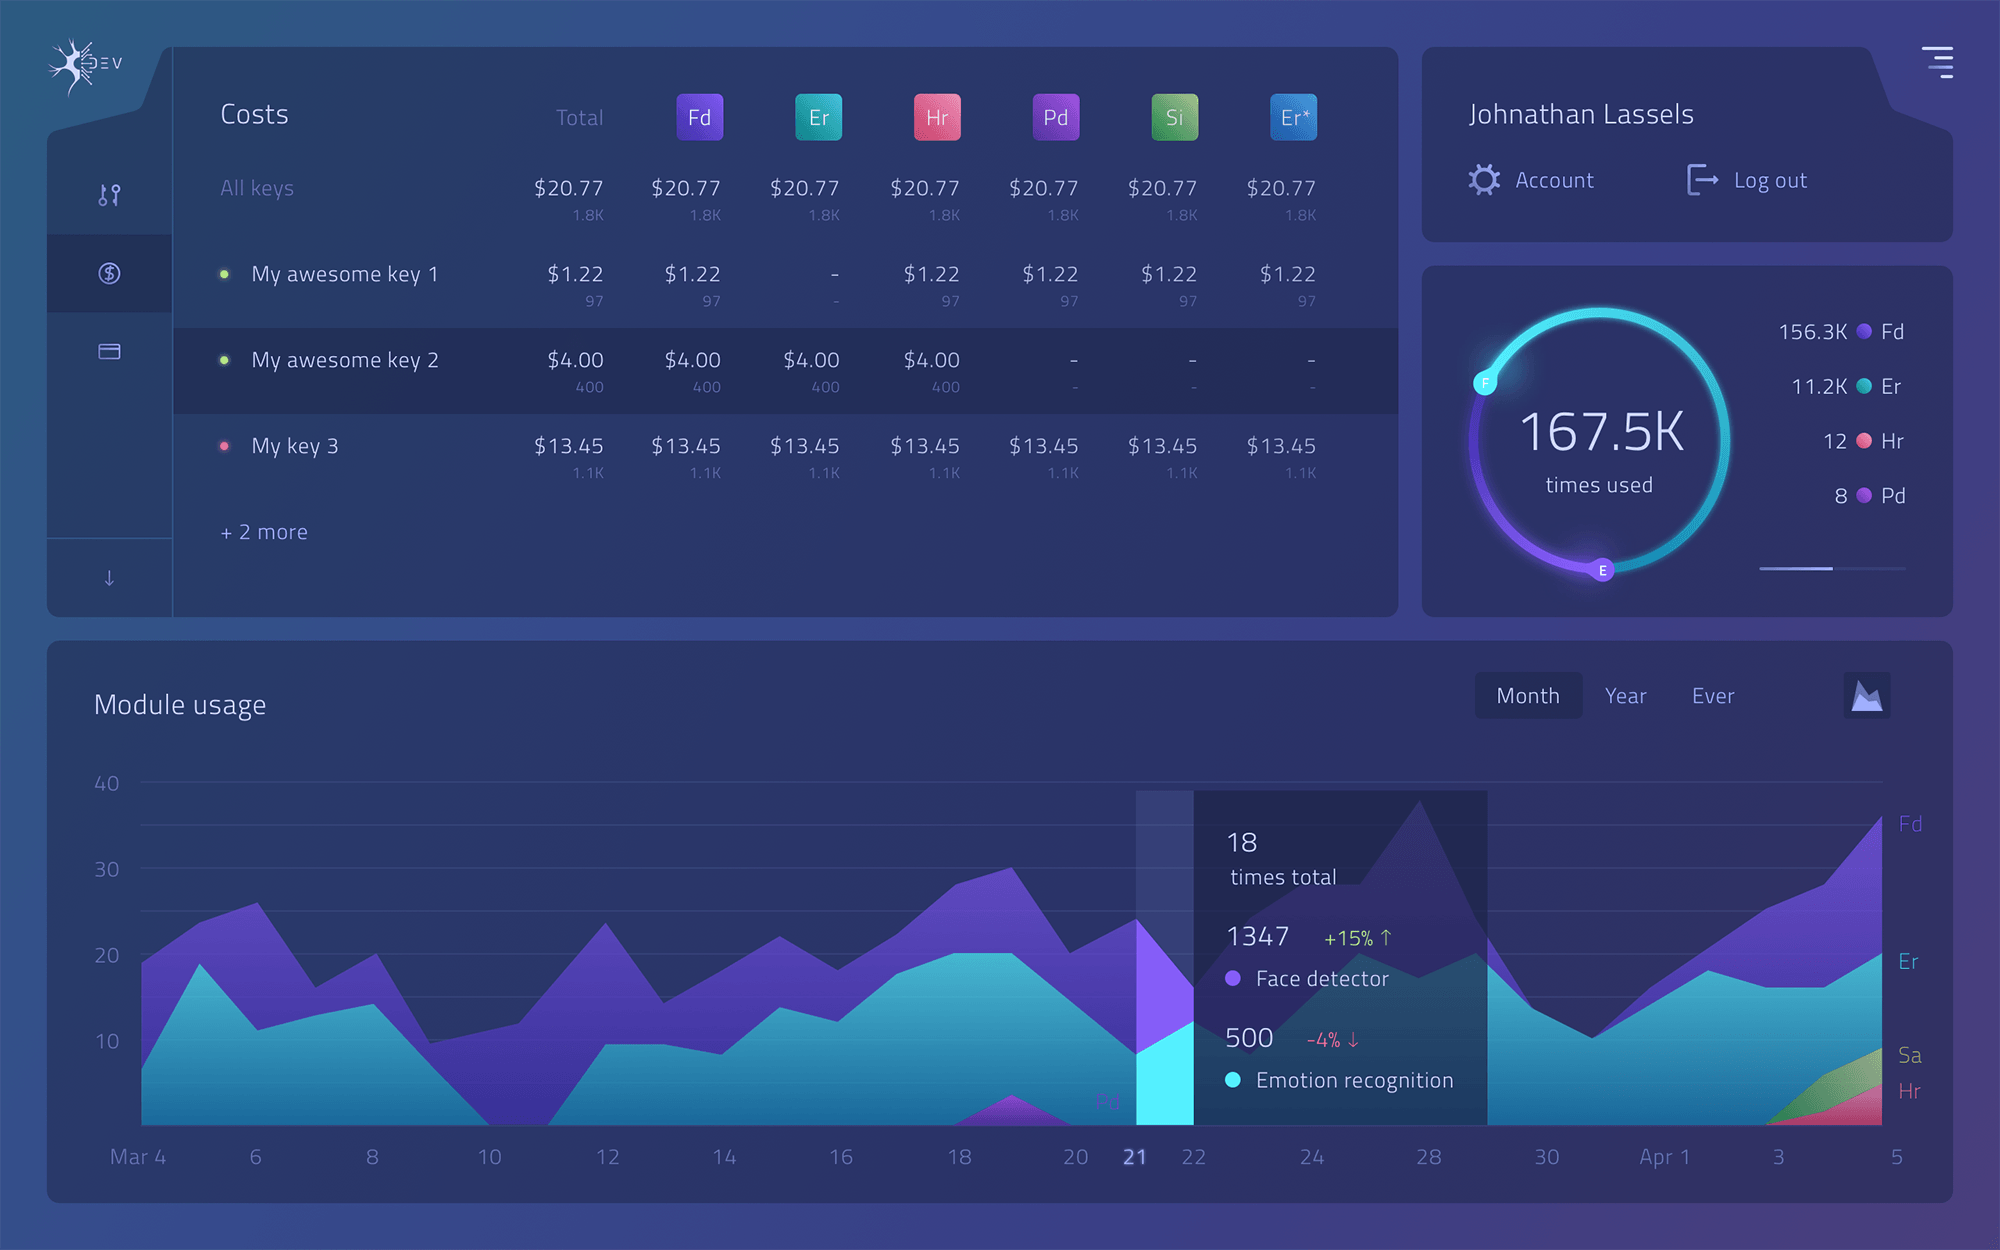
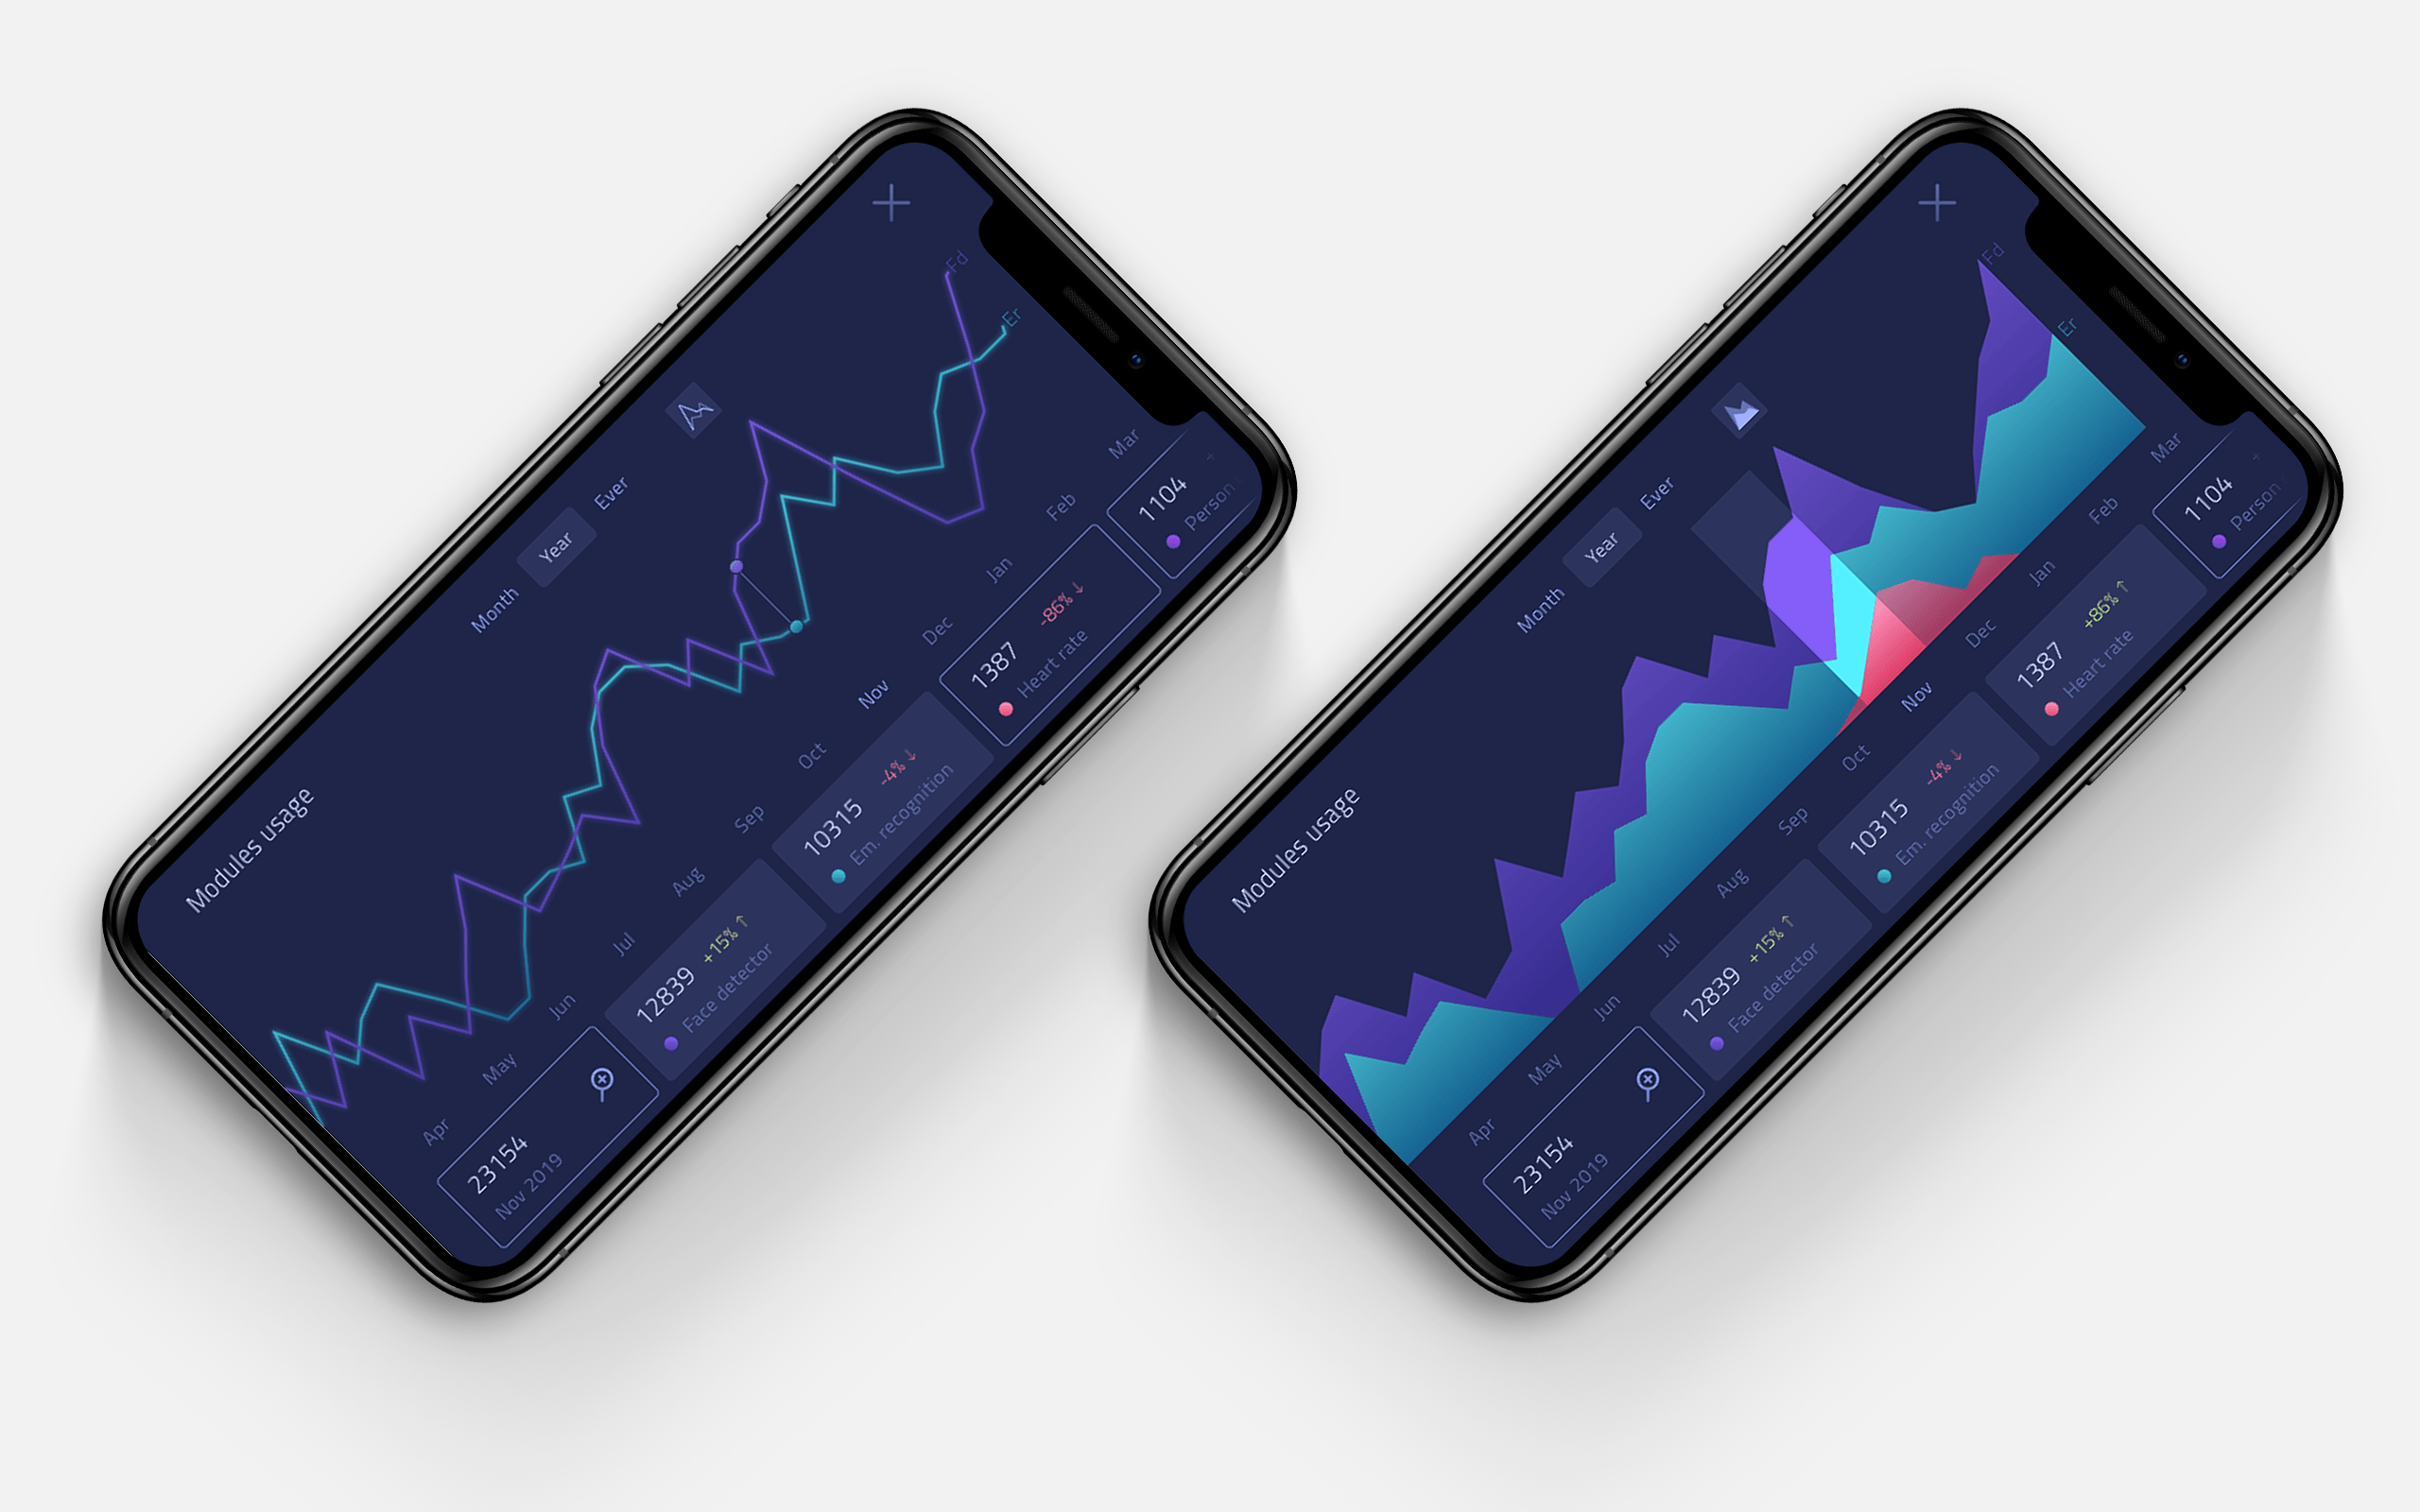
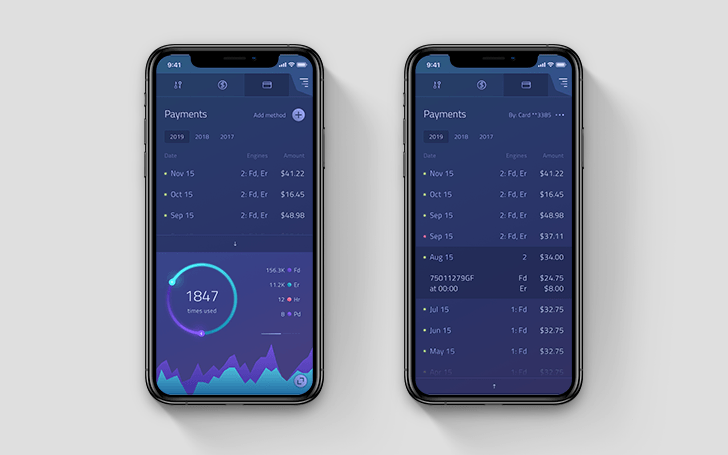
Costs and usage
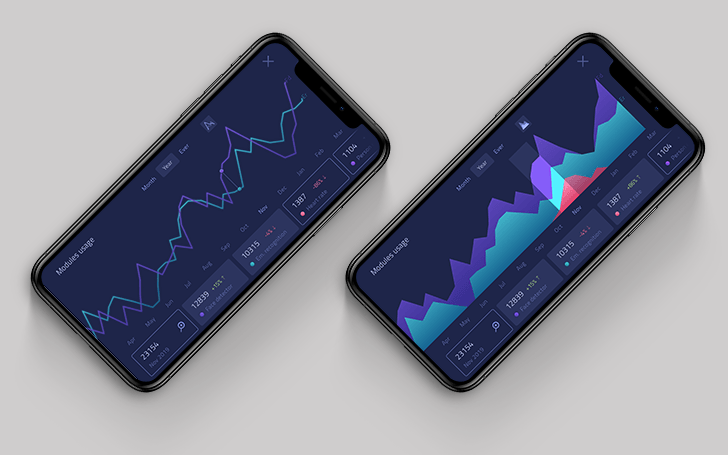
Users are billed monthly based on the usage. 'Costs' tab shows spendings and usage (how many images/frames processed) per key per module for all keys active in the current payment period (month). Screens below also show states of the usage graph.
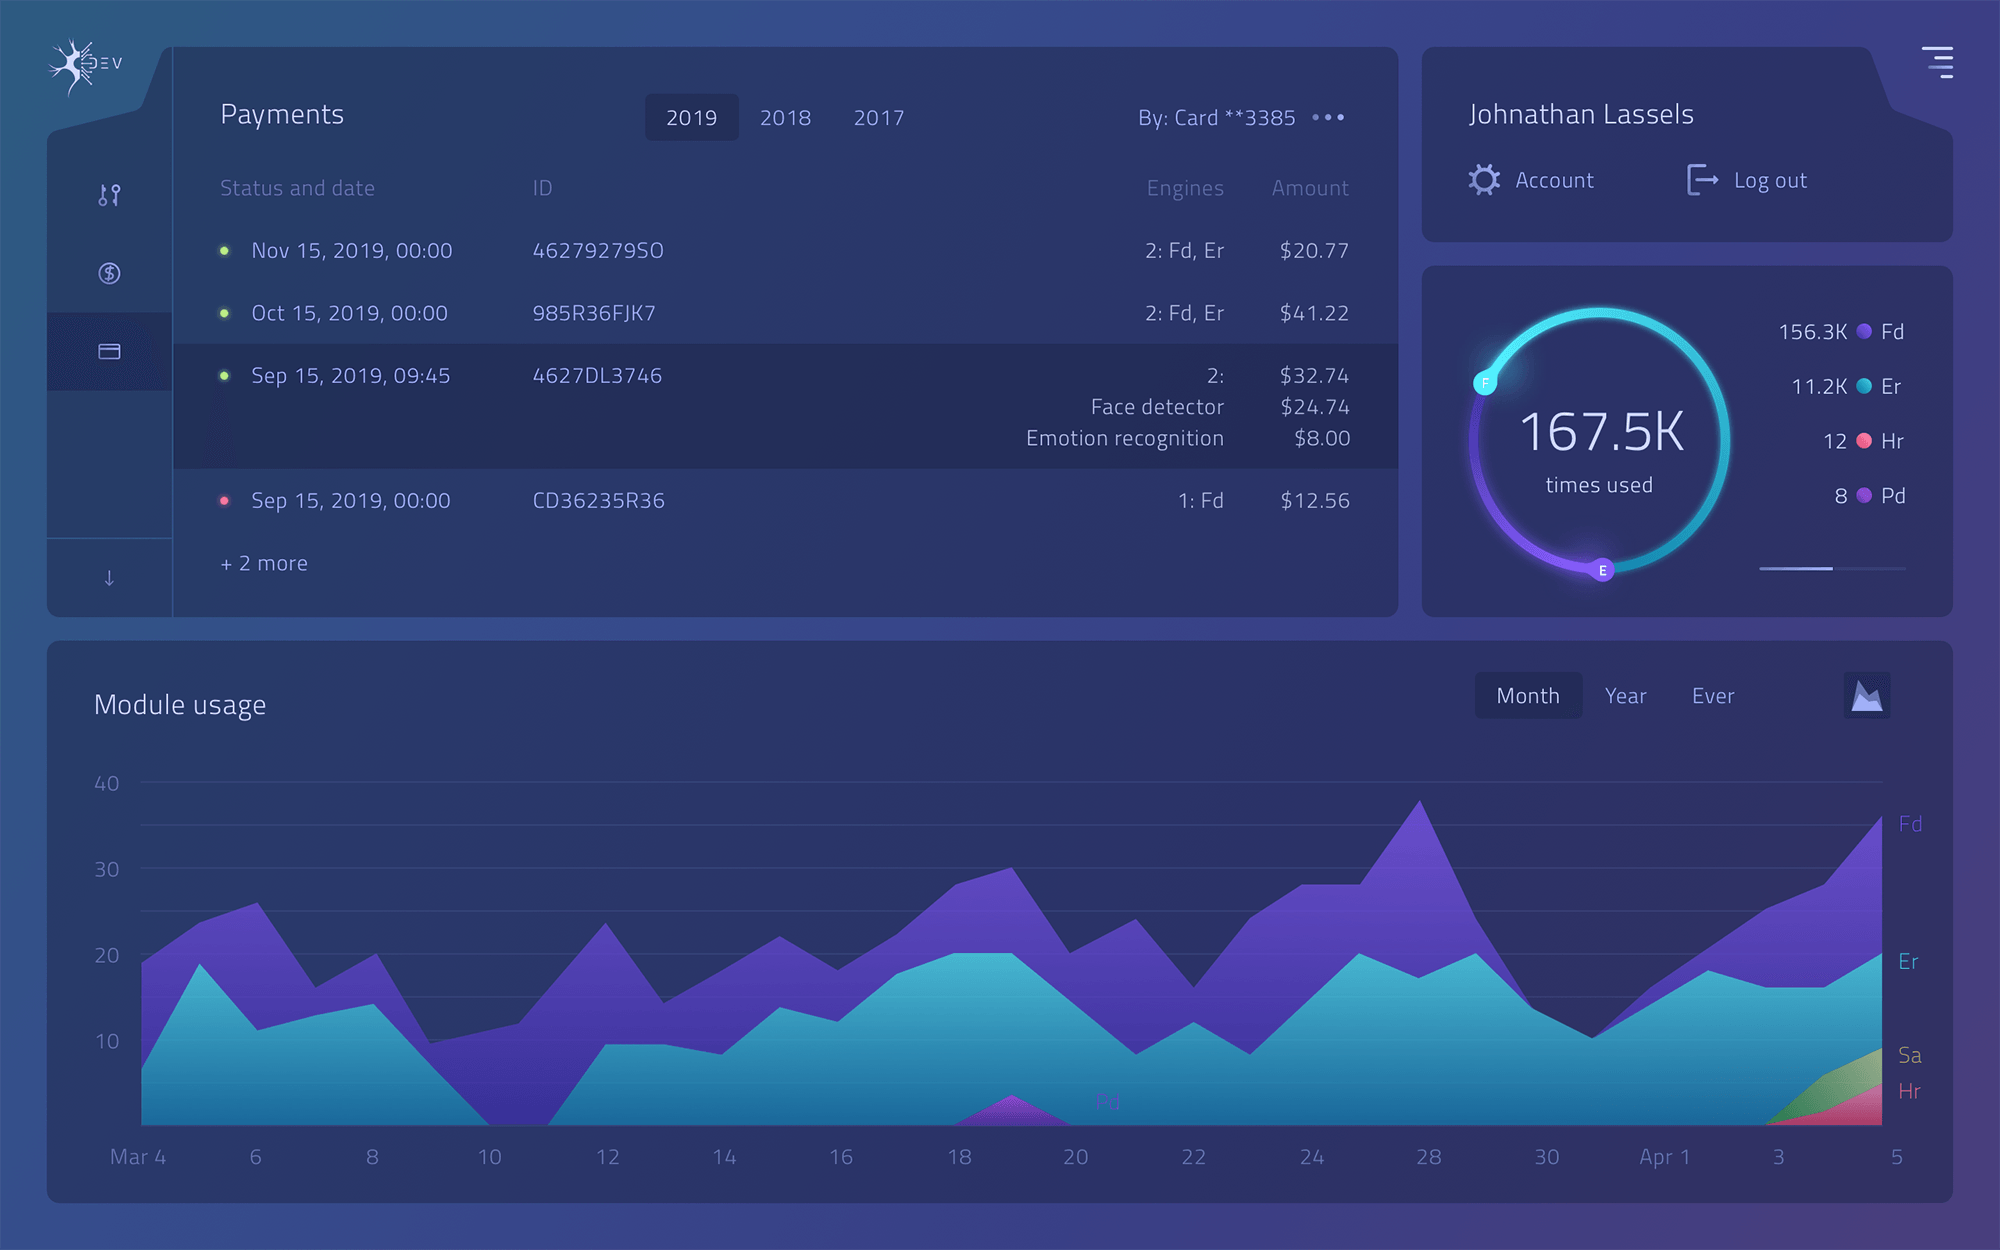
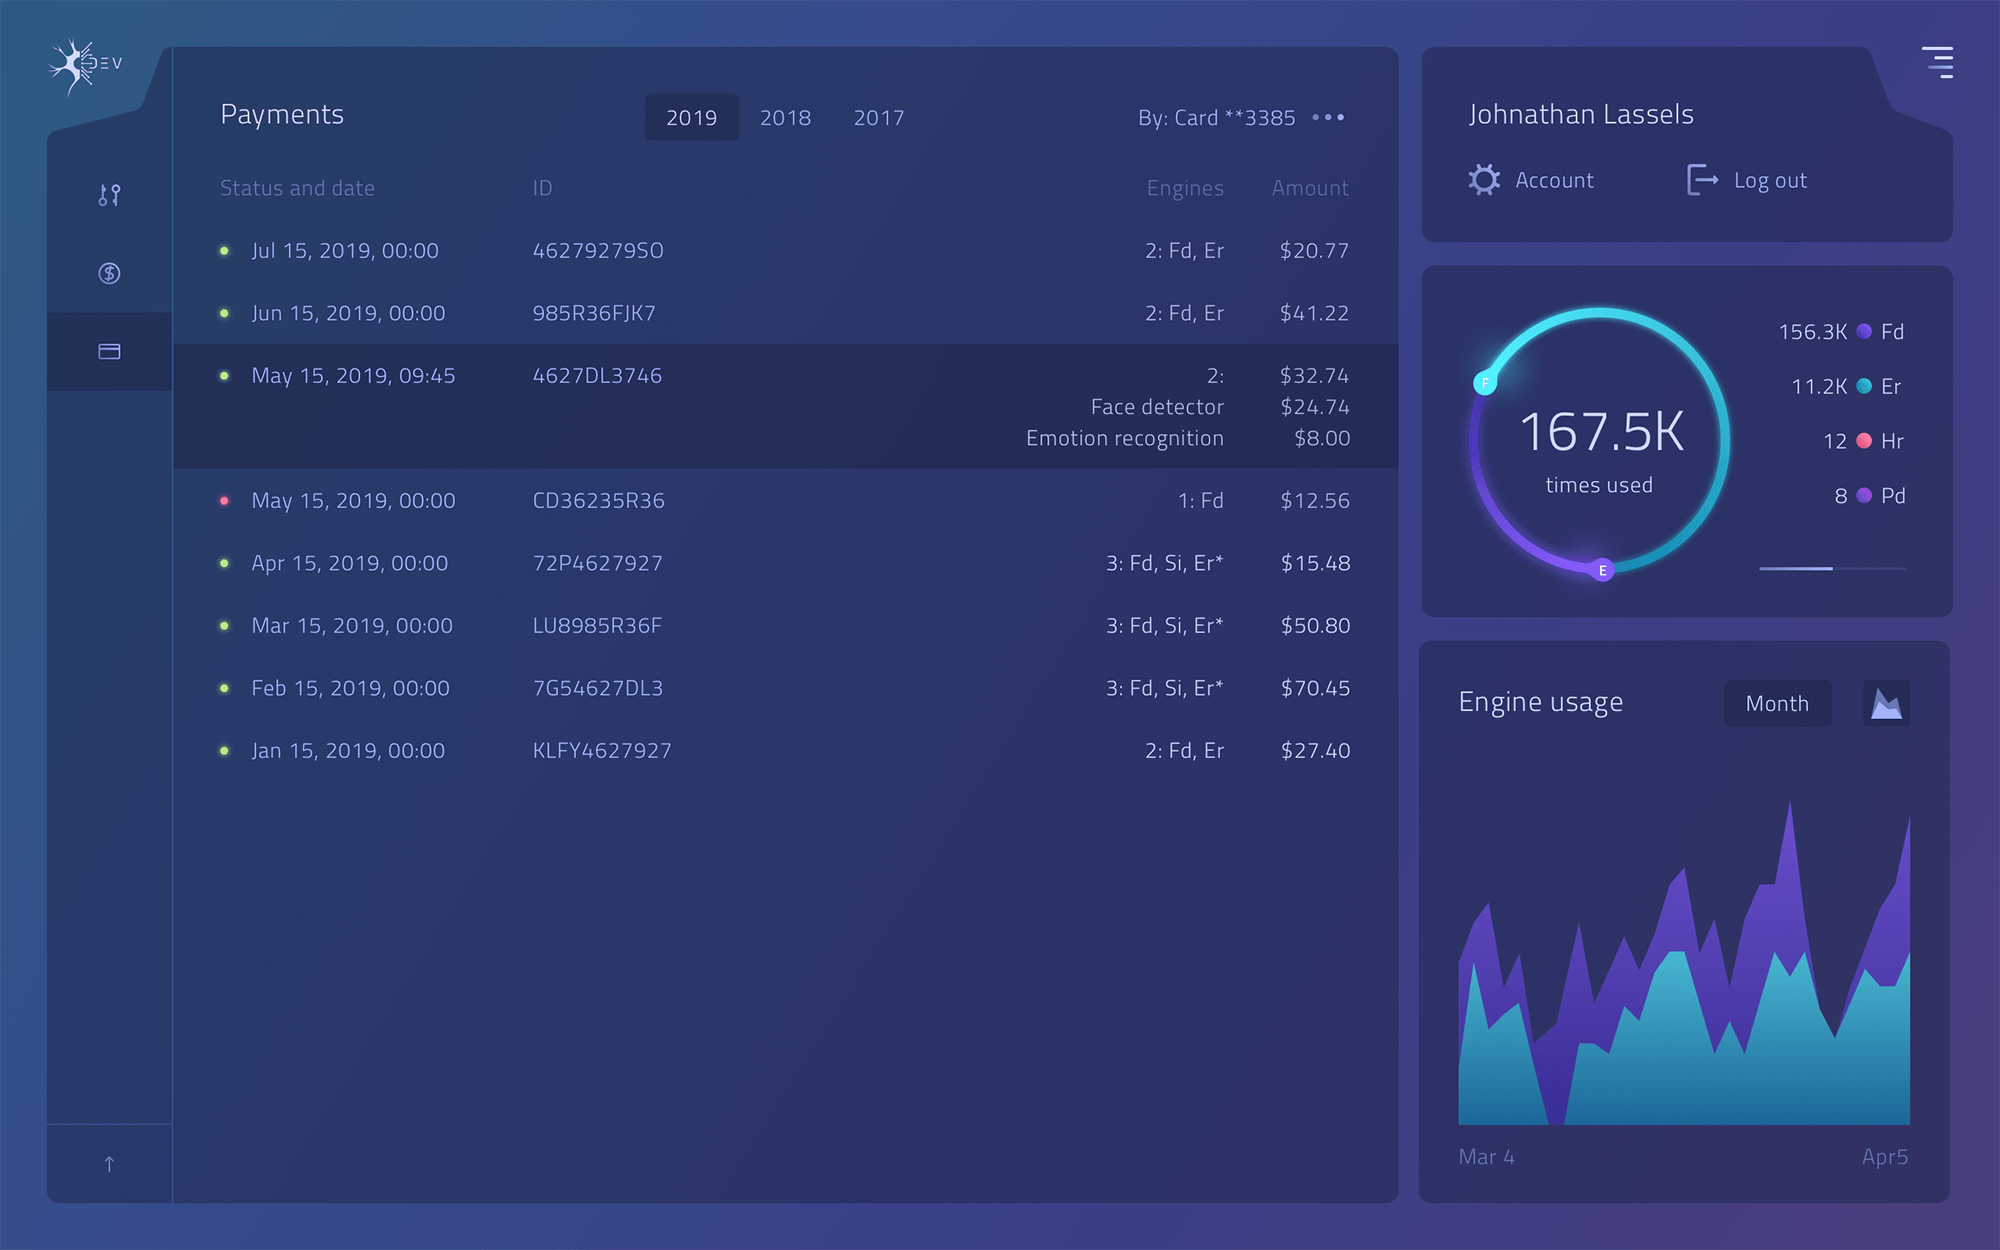
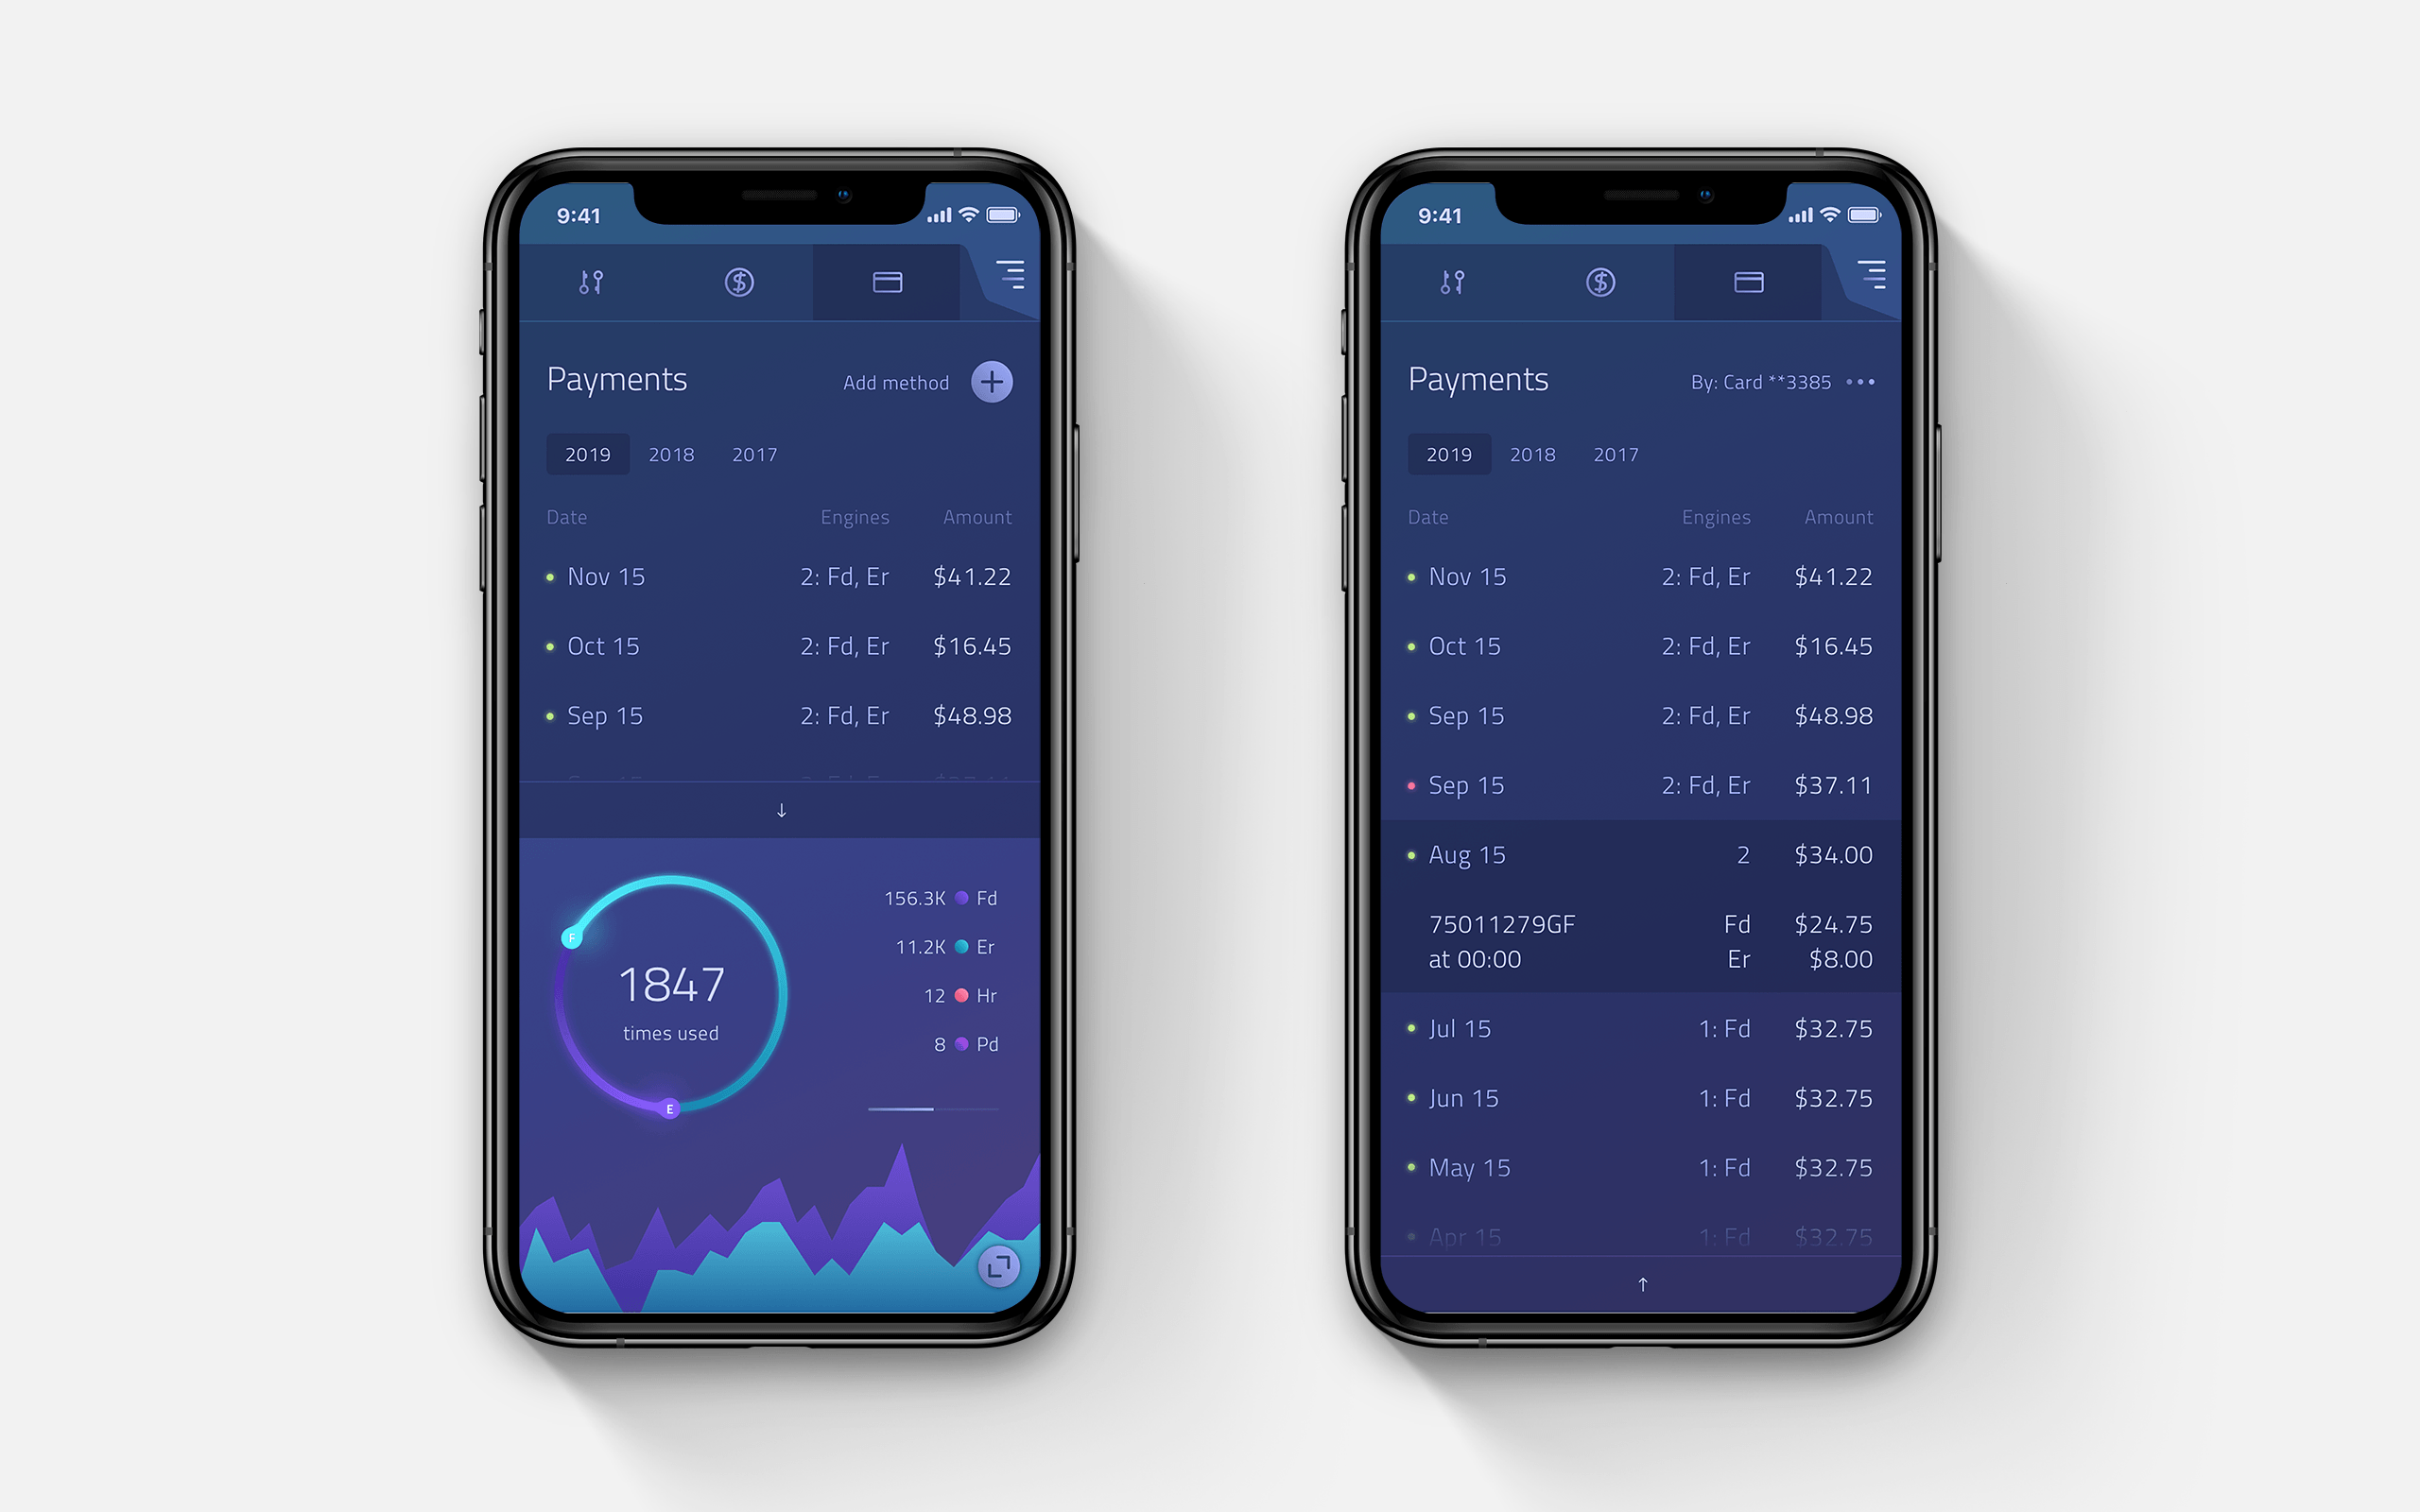
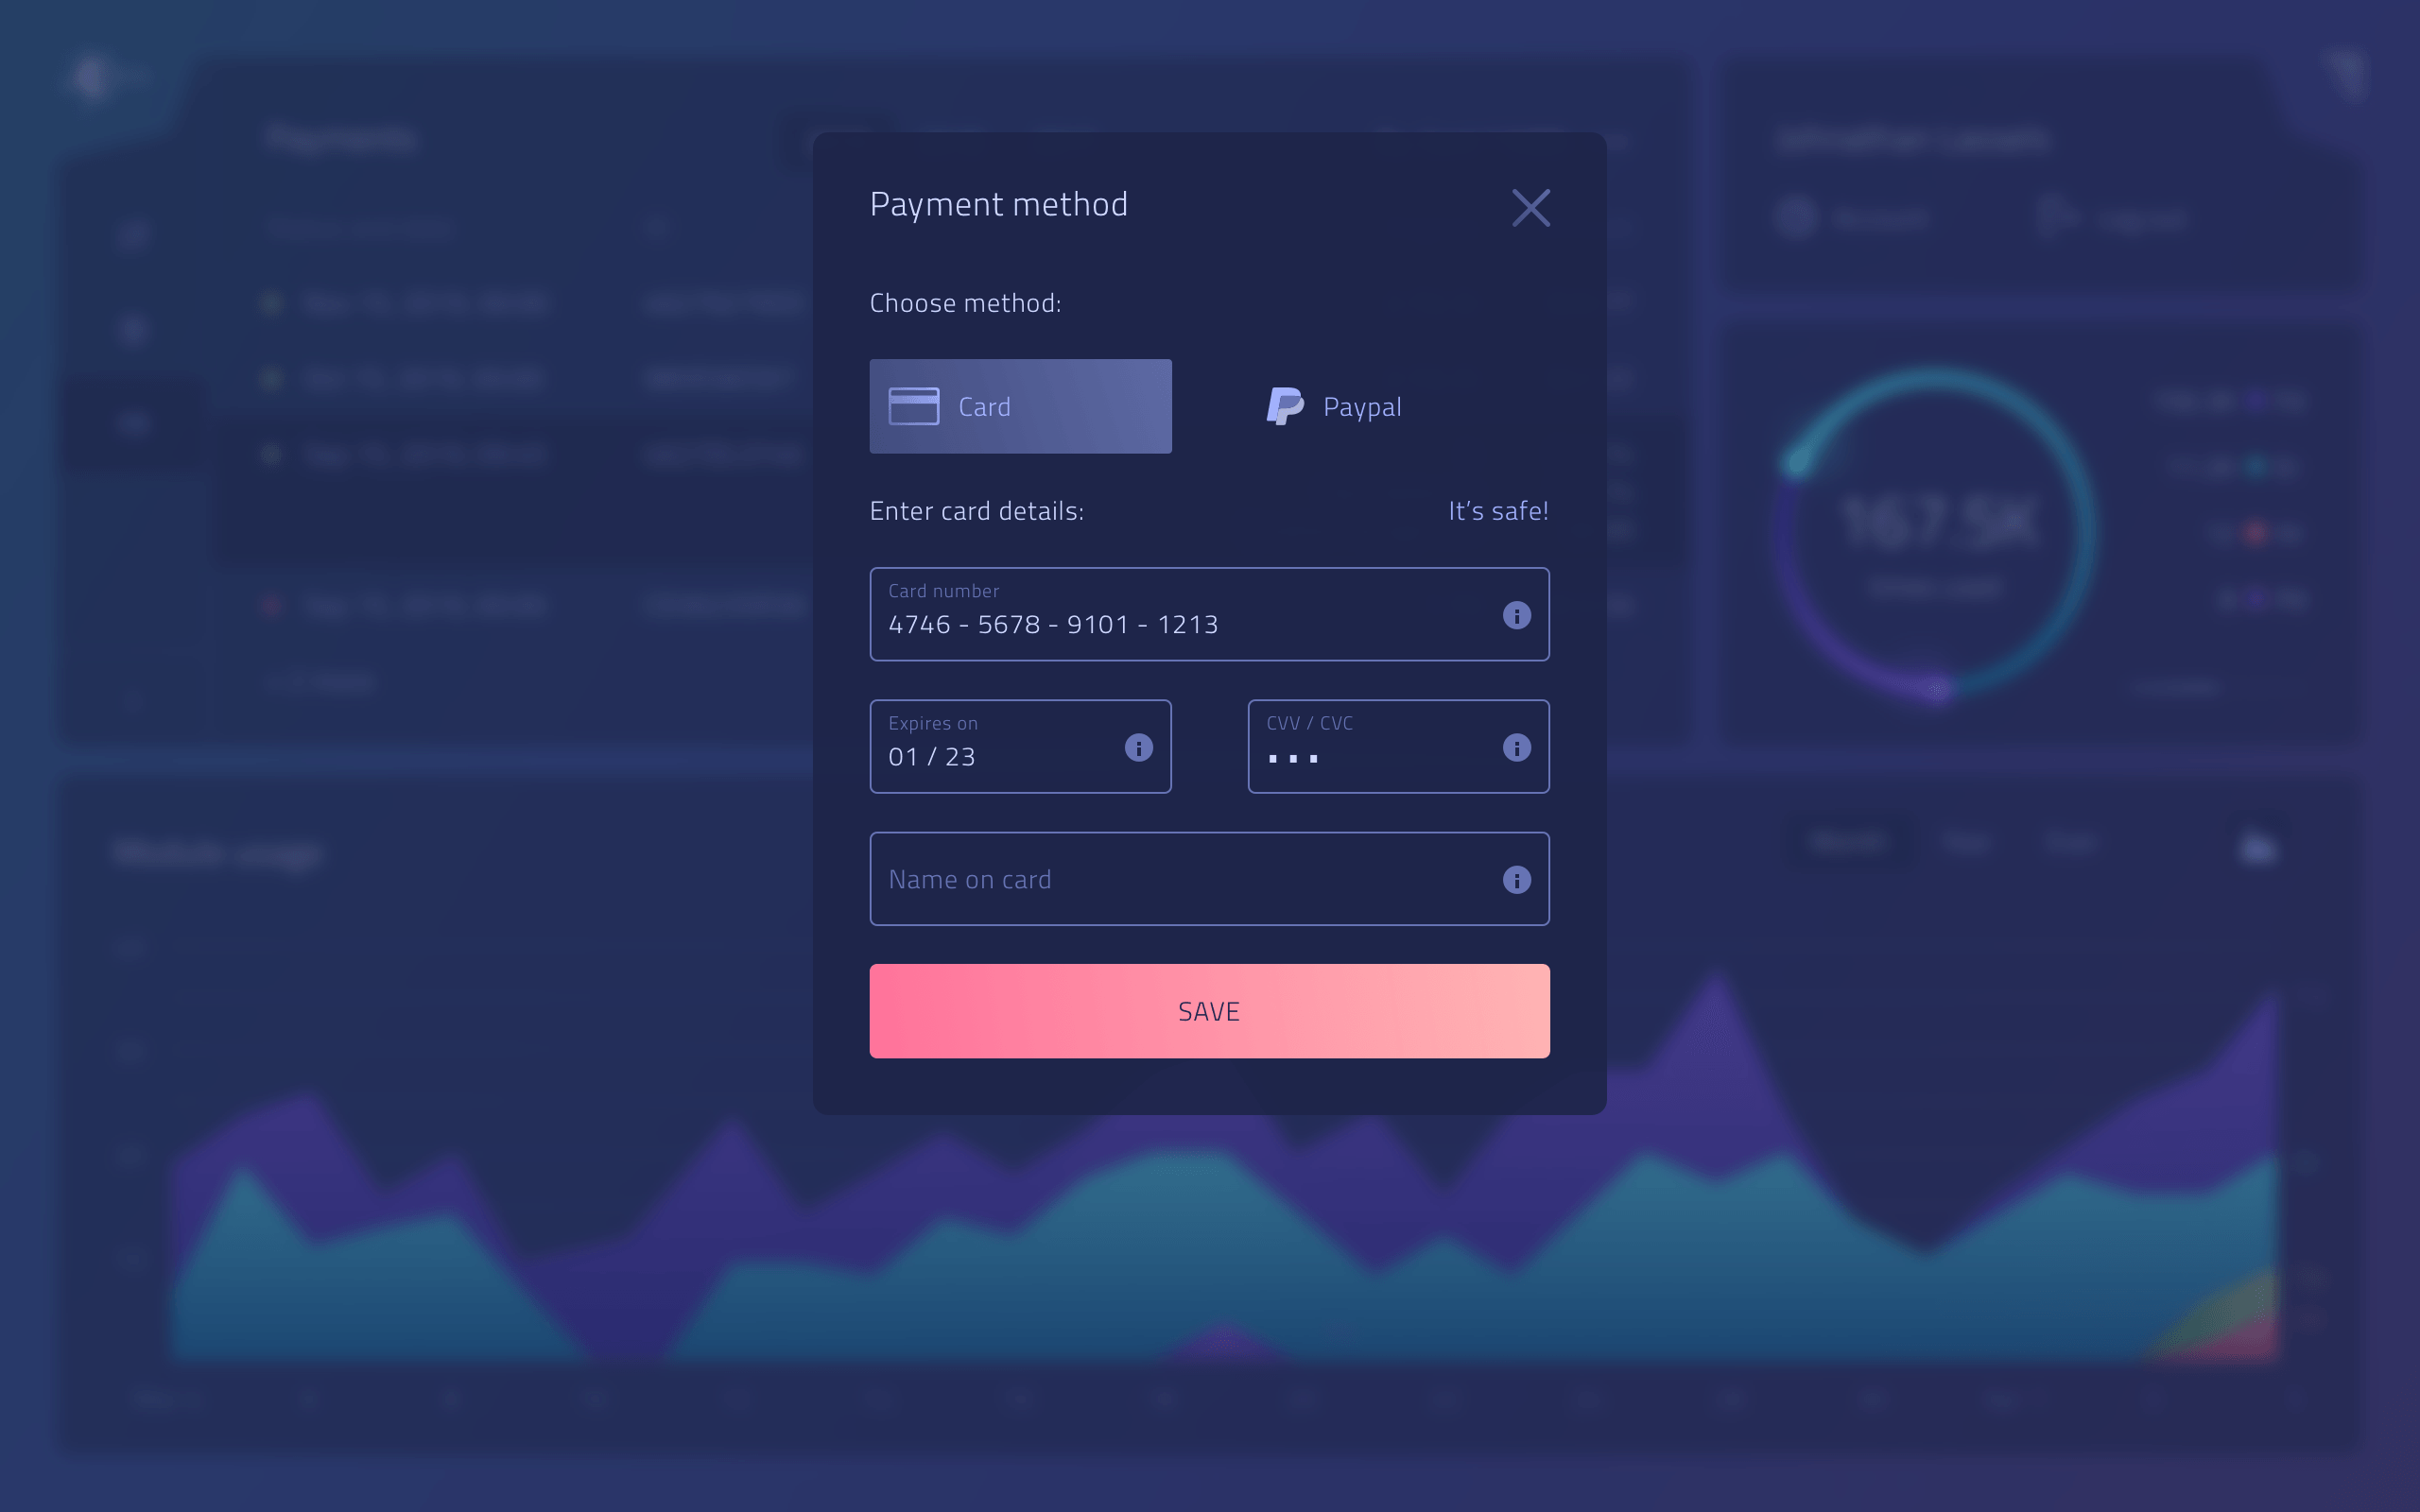
Payments
A transaction history with breakdowns per module.
Home
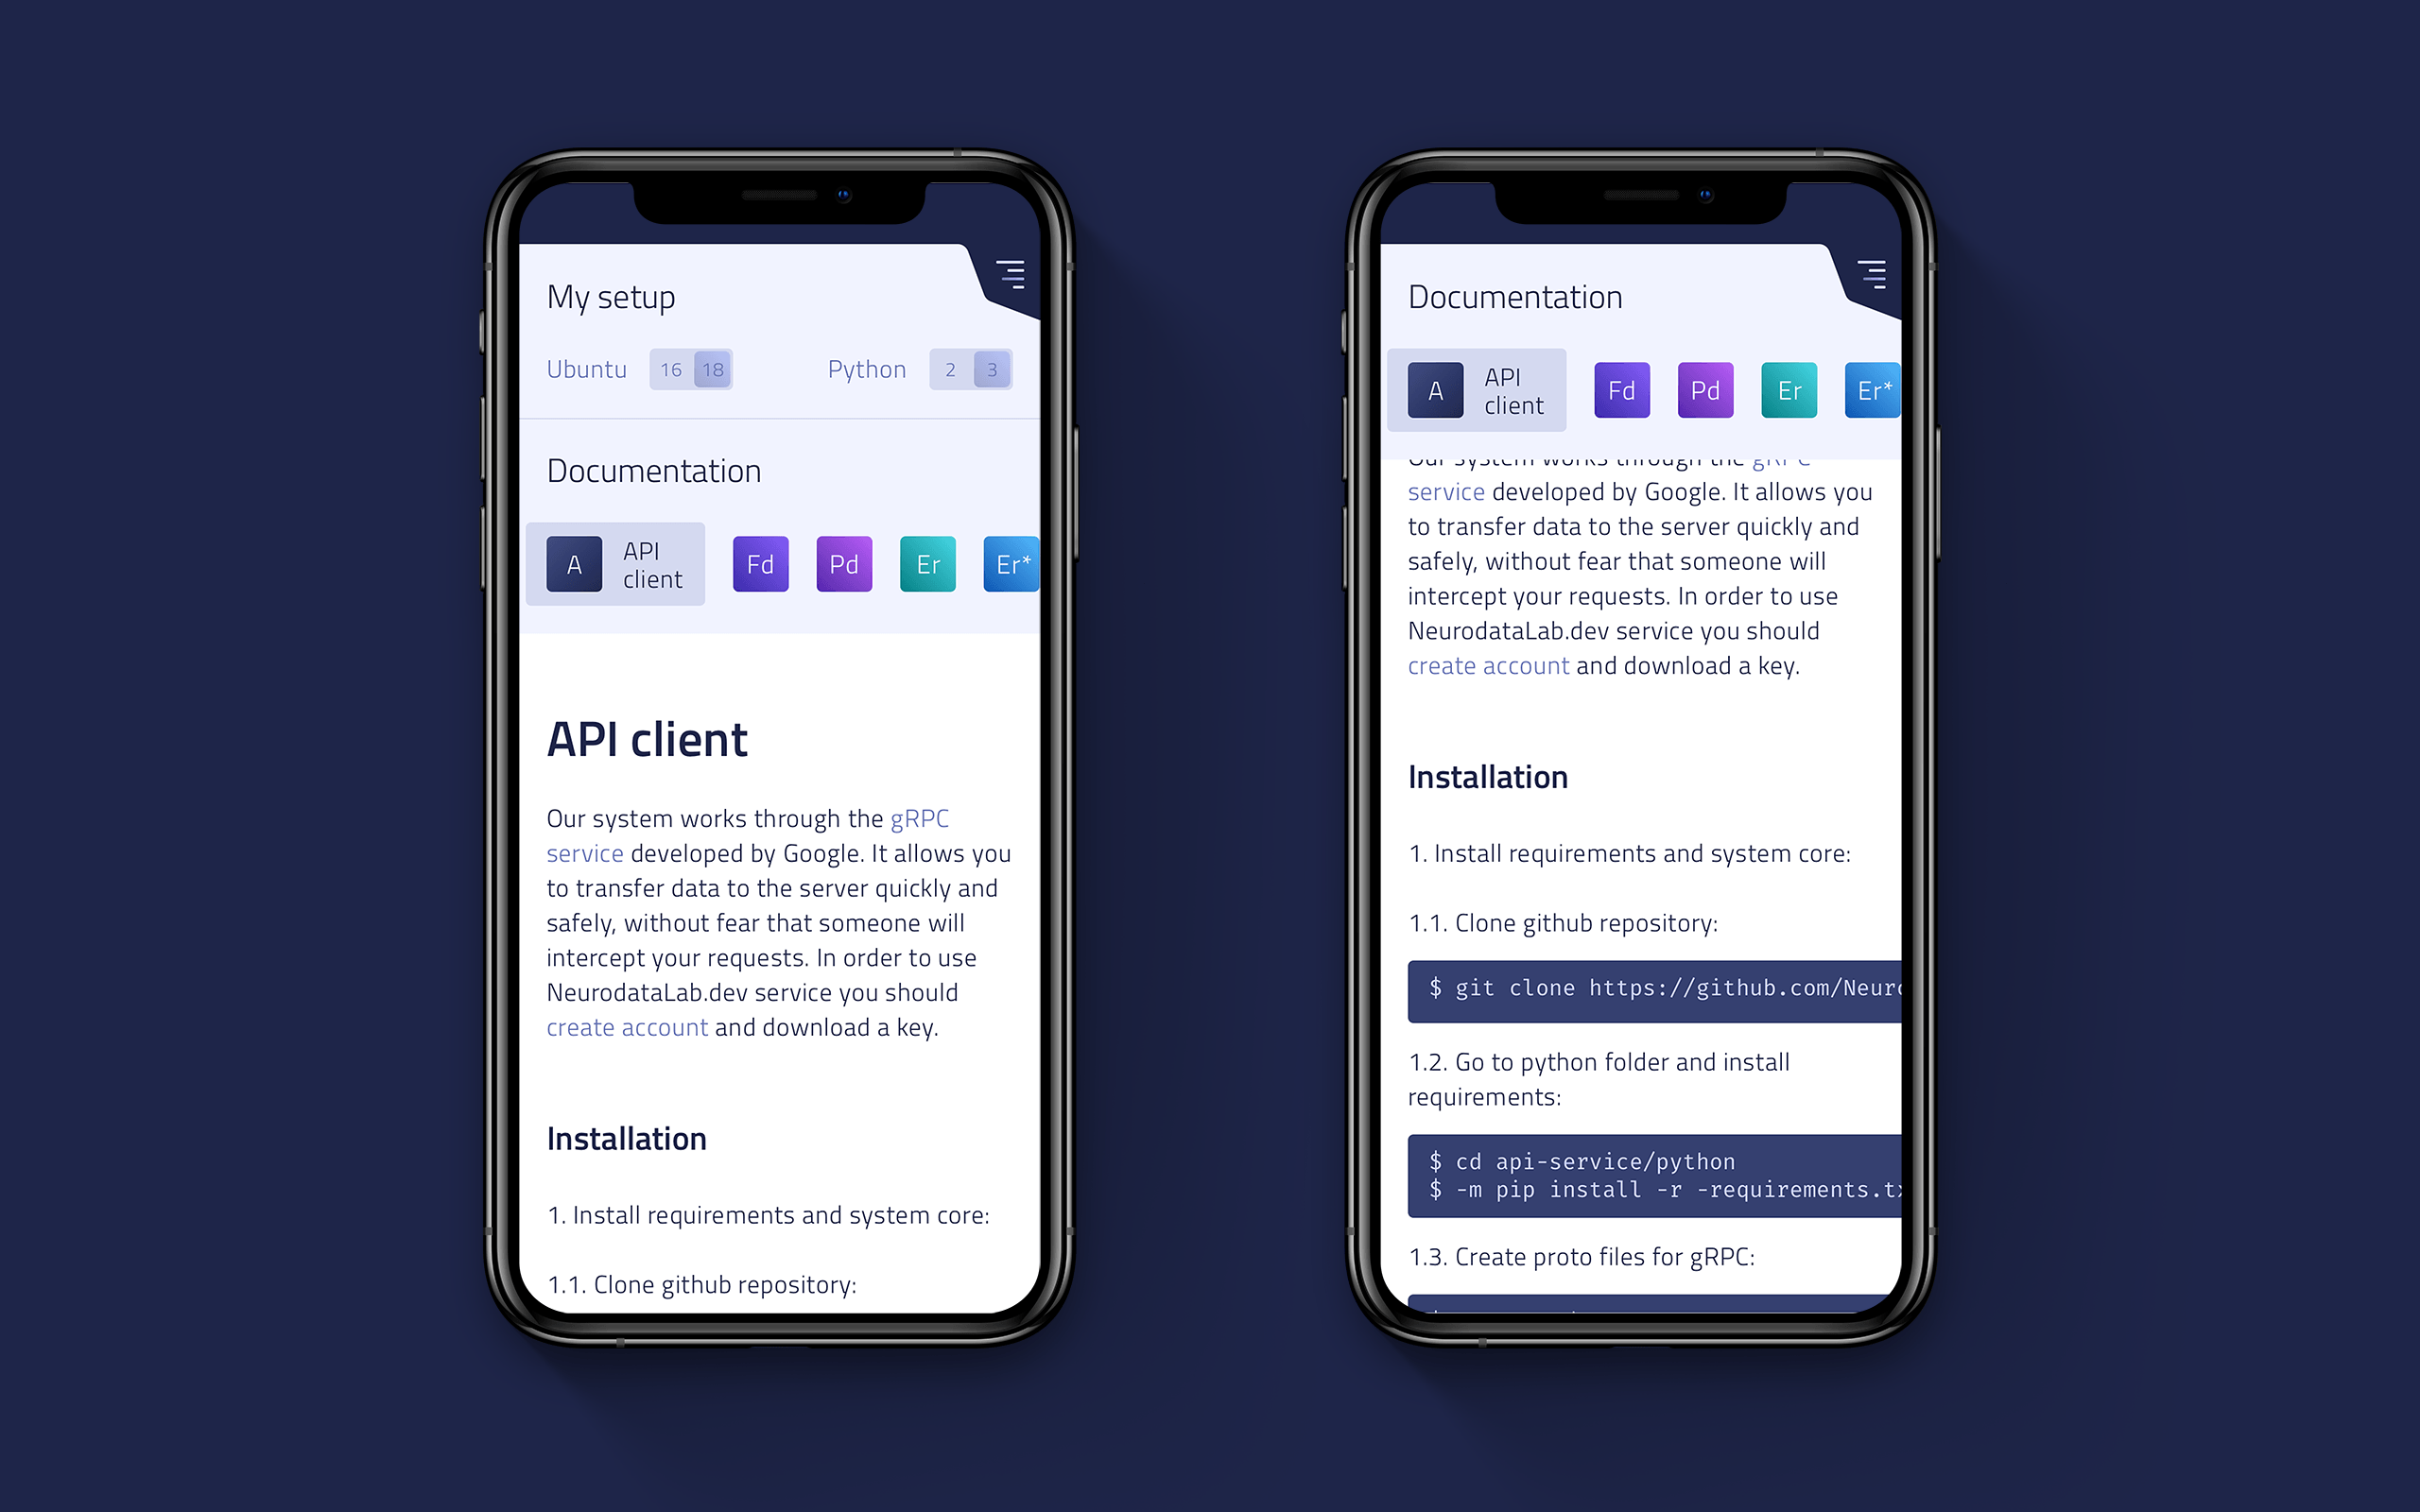
Docs