Micewalk
Machine learning
Classification on Catwalk XT data for ALS-targeting research in Institute of Physiologically Active Compounds (IPAC). Ongoing project I started as my bachelor thesis.
What do biologists do
Research
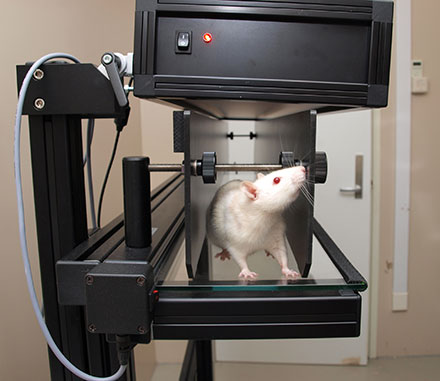
Amyotrophic lateral sclerosis is a lethal disease. There are no treatments increasing patient's life significantly. The Cell Technologies Group of IPAC RAS (I'll call just "lab") is studying a specific gene known as one of the ALS causes: FUS. For that they have two lines of animals:
- FUS - transgenic mice with FUS gene, i.e. ill mice.
- WT - wild type mice - normal healthy mice.
As ALS is a neurodegenerative disease, is affects motor features. Observing motor features we can draw certain conclusions about disease states and effectiveness of possible treatments.
Data and dimensions
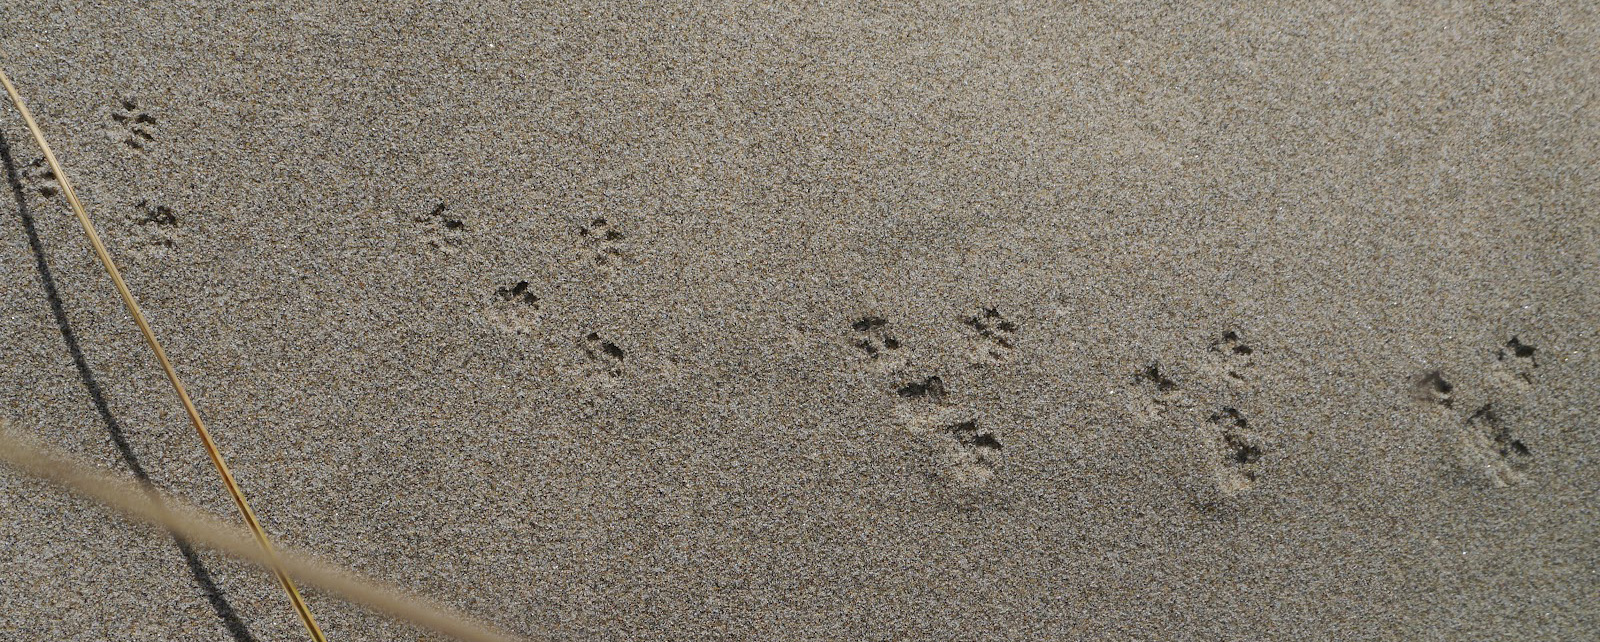
Observations are made with Noldus CatWalk™ XT system which captures animal footprints and calculates some statistics based on footprint measurements. Footprints can be measured manually or - as in our case - automatically.
Output is a row of 350+ numbers per animal - too much for a human to take a look and come up with a conclusion. At the same time - dataset is extremely small due to troublesome* data collection.
* - Besides the transgenic animal itself which you need to breed and raise until a specific age, to produce a row of data we need 4 valid runs per animal. That means you should make mice - half of which are sick - to run through some scary place with a certain velocity dispersion. Well, sometimes mice prefer to pee on the scary place or just to sit in a corner. While biologists can't pee during the experiment as it requires an aseptic floor where, obviously, you have no toilet. On the top of it they used to do ~ 600 clicks per animal in Catwalk soft to measure footprint manually. Now we know that automatic measurement is precise enough for us, but back then it was the only option to have at least some data. I should say all this is still much better than to dip a mouse into ink, make it walk on a piece of paper and then measure the footprints with a ruler as biologists did back in time.
We had more features (numbers in a row) than samples (rows), i.e. totally cursed with dimensionality.
How can I help
My bachelor thesis
- 379 parameters?! What you was going to do with them before I came by?
- I don't know... do some excel stuff...
The objective of my bachelor thesis "Machine learning tools for laboratory mice motor functions research" was to prove or disprove the possibility to build a model that solves classification problem for the data corpus available in the moment.
Long story short - classification succeed. I was graduated with ‘excellent’.
Real life
I had a draft model and the conclusion hope that ML classification is possible on the output of CatWalk XT (which is barely has competitors as tool) and one day will really help the original mission - treatment evaluation.
I continued the collaboration with the lab and basically - new data, new scenario, more code, new model. For now I have a method I hope to publish. I.e. a scenario and code to build a model that can classify = say if an animal has FUS gene or not following on from Catwalk-generated ‘row of numbers’. Within it the so-called ‘important features’ are distinguished - those difference in which is reflective of the disease.
If you are curious how can we evaluate a treatment
With more troublesome data collection first as we need treated animals. More specifically, 4 groups: treated FUS, treated wild, placebo treated FUS, placebo treated wild.
A classifier in fact returns not just 1 or 0, but a probability in the range [0,1]. I.e. not just ill or healthy, but ‘how much ill’. So if we lucky a treated FUS animal will be ‘less ill than it should be ceteris paribus’, while there will be no statistically significant difference between both wild type groups.
The whole story timeline
| What | Who | Dataset | Outcome | |
|---|---|---|---|---|
| Find "magic buttons" in Catwalk soft to automate footprint measurement | Both | - | Lost some precision. Got ~200 rows instead of 12 | |
| My bachelor thesis: prove that classification on Catwalk data is possible, method estaiblished | Me | ~160 FUS/wt mice | Possible important features (well, and a diploma :) | |
| Me | ~45 treated FUS/wt mice | - | ||
| Collect more data | Lab | - | Got ~500 mice instead of 160 | |
| Revisit and improve the method and code | Me | ~500 mice FUS/wt mice | 14 important features with XGBoots AUC ~ 0.9 if thainig on them only | |
| Publish the research | Lab | - | ||
| Publish the method | Me | - | ||
| Share code | Me | - | ||
| Use the model for the treatment evaluation when any | Both | - |